A Look Through the Indices
This week saw a number of key economic events which drove the market action not least a surprise US NFP jobs data Friday which catalysed some selling . The NASDAQ reversed from an all-time high intraday to selling-off in an ugly reversal. To date every dip has been bought, though the weakness shown in Nvidia may signal a deeper pullback to come. Both the Nikkei and the Euronext 100 made all-time highs on Thursday, while the S &P 500 made an all-time high on Friday before reversing to close -0.65%. Given the parabolic moves in some of these indices and the relatively narrow breath of the participants, the balance of probability would be for a more meaningful pullback for now with the potential rotation in to other sectors. That being said animal spirits particularly in the meme-like AI names are always difficult to predict so irrationality can persist beyond the available liquidity to short it . Typically, when they reverse, they reverse hard and fast.
(Clicking on charts and plots makes them full screen - click on the "x" in the upper right corner to return to article )
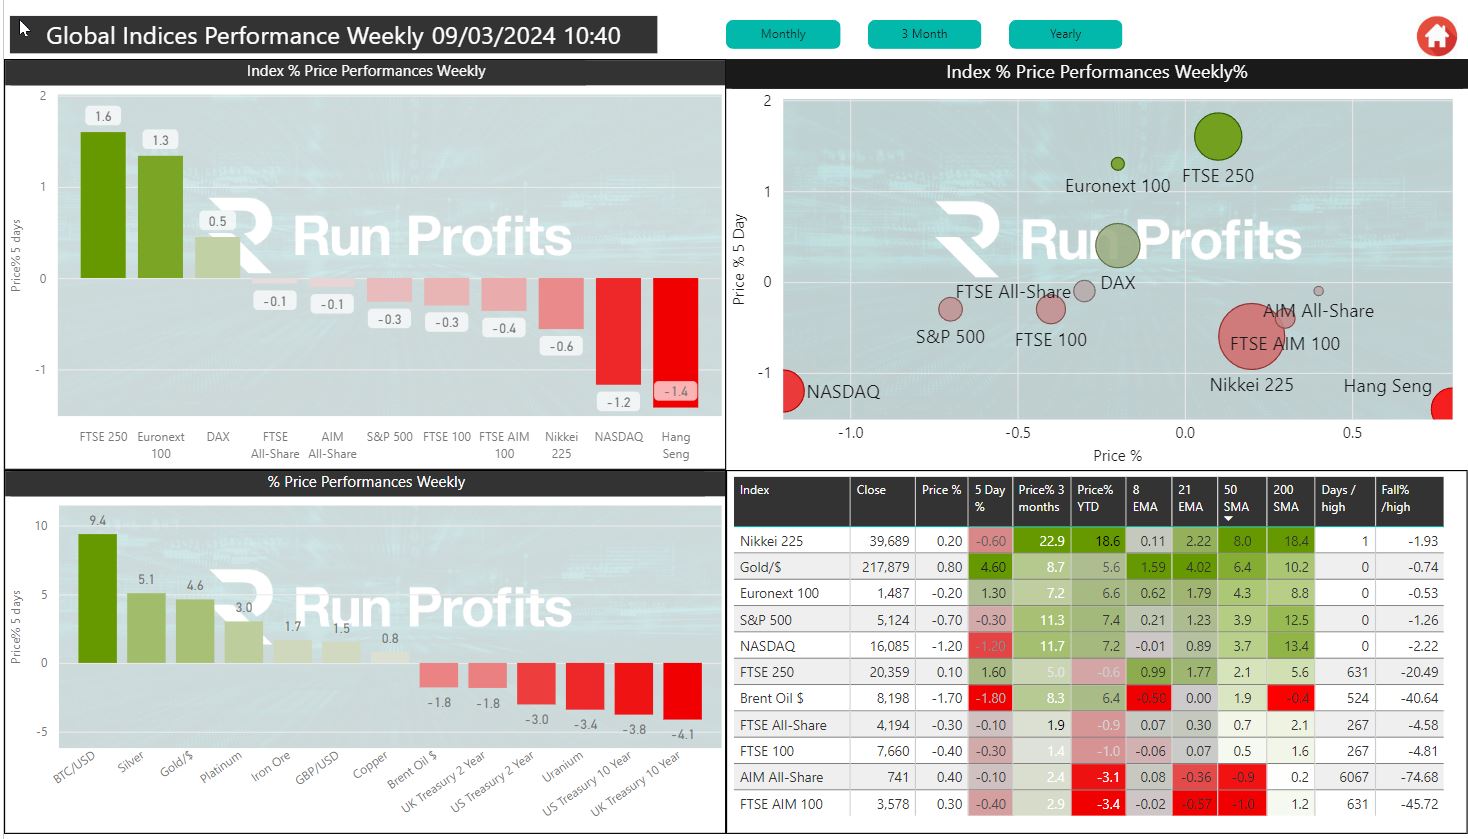
The rally to all-time-highs in bitcoin, and gold this week is noteworthy and may be signalling some caution over macro conditions.
in the UK an otherwise fairly underwhelming budget may impact the FTSE 250 with the announcement of a GB ISA to invest in UK based companies: but most of the +1.6% gain on the on the week in the mid caps was down to takeovers of Spirent(+63%) and VMUK (+35%) while JUST rallied 17% on the week with a TU Friday and Hochschild Mining HOC (my PMM Miner pick from last week's wrap) made +15.4%
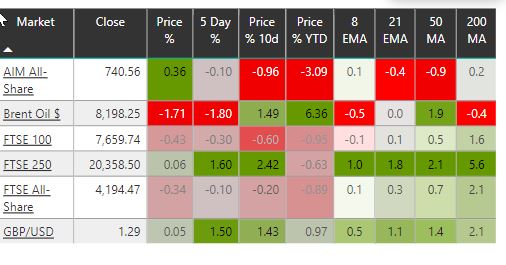
Despite continued all time highs in other global indices, all of the UK indices still remain red for the year to date - the FTE100 is within 5% of its ATH with the 250 over 20% away and AIM 75% below its ATH. On the week just closed both the mega caps and the small caps closed marginally in the red - see table
Dollar and Commodities : Gold Parabolic to ATHs, Silver plays catch-up: Copper on a breakout,
In last week’s wrap I highlighted the significant breakout in gold from a long consolidation period – and how it was likely to transmit to some of the other commodities especially the metals and silver
…….. the strong rally in gold on Friday which added 1.9% to the $2082 after a long period of consolidation may give some reason to believe the rest of the commodities complex might follow. Silver also participated in the rally but stopped short of its 200 MA, retreating intraday- this is a level to watch next week.
This proved to be the case with strength in silver , second best performer +5.1% on the week with gold platinum, palladium, iron ore and to a lesser extent copper all rallying.
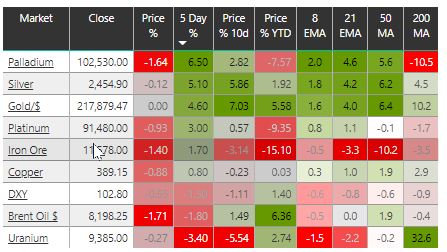
. This was supported by further weakness in the dollar index
(Clicking on charts and plots makes them full screen - click on the "x" in the upper right corner to return to article )

Dollar Index Drops 200 and 50MAs to Jan '24 Support
The dollar did have two strong down days dropping below both the 200 MA and the 50 MA to test support back to January 24th before forming a hammer on the daily Friday at support. Next week sees some big macroeconomic events including unemployment data, GDP and production data for the UK : German and US CPI , US retail sales , ECB meeting, and US PPI Thursday -see calendar 
Gold goes parabolic to new ATHs
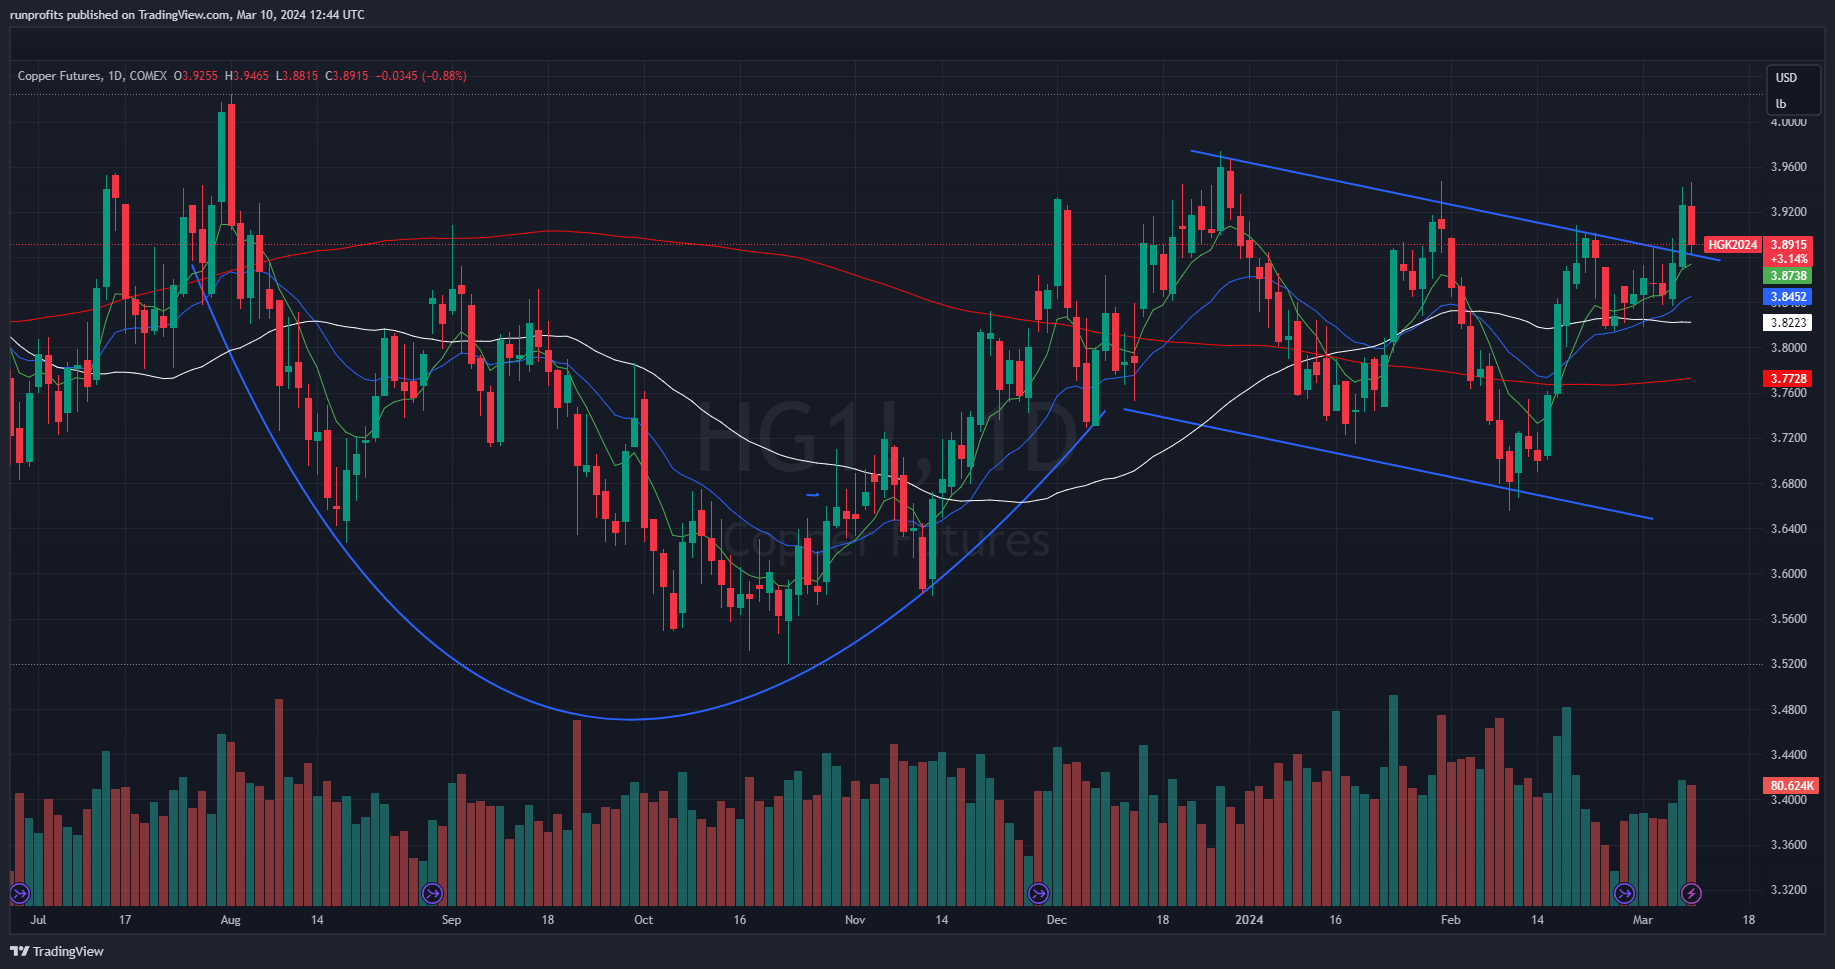
Copper attempting a breakout from a cup-and-handle consolidation pattern
Copper has formed a textbook cup and handle pattern which tends to signify a forthcoming breakout from a consolidation period. The chart above shows the breakout from the handle of the password, however this reverse likely so it is one to watch and is dependent on both dollar strength and demand especially from China. Assuming we see continued dollar weakness and some strength in the Chinese force then copper may well continue this breakout. If that is the case then it should be bullish the base metal miners and a number of the UK stocks
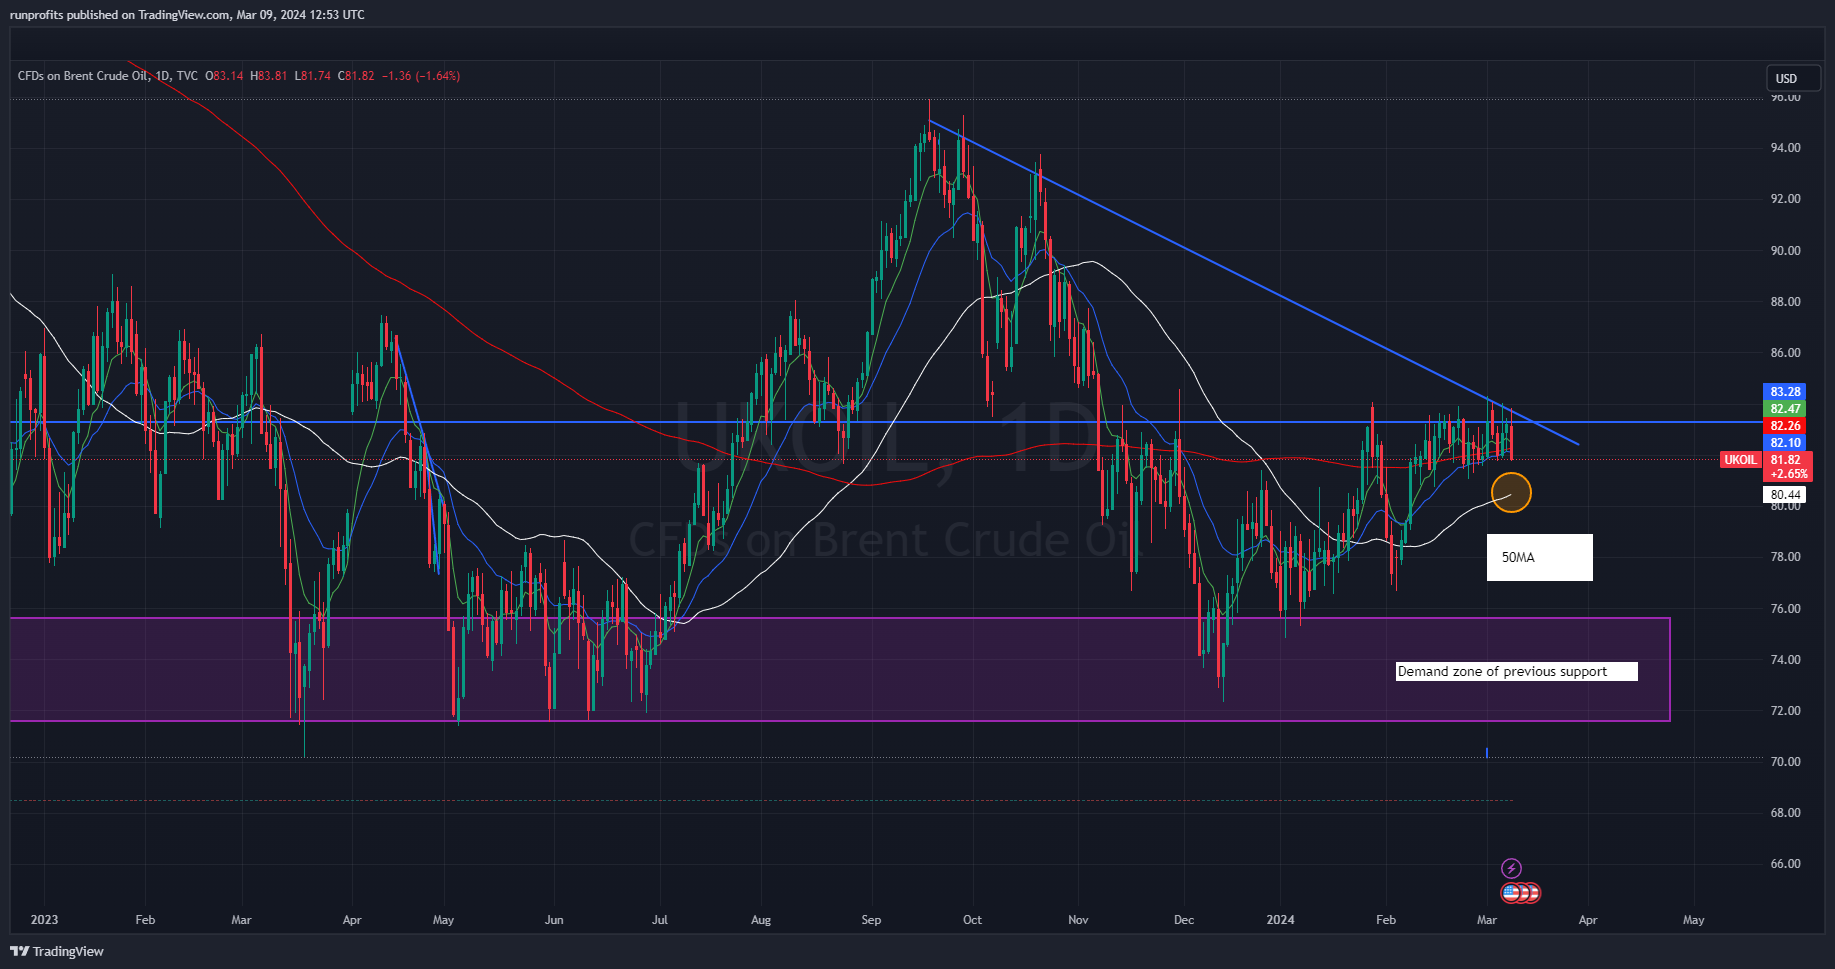
Brent Crude fail to breakout at key resistance level - what next?
My call on oil to break out proved short lived as the resistance level around $84 did persist despite OPEC+ best attempts to constrain supply – I did highlight oversupply especially from the US. This week saw additional inventory data supporting this especially the US Cushing data Wed. Reduced refining capacity being partly to blame. Data also on accumulation of natural gas inventories with record levels of storage in Europe. Persistent mild weather will be unlikely to change this in what remains of the cold season. Finally, weaker US ISM data pointed to lower economic activity supporting weaker energy demand. From a technical point of view, chart shows we remain relatively range bound with the 50 MA around 80.4 likely to be tested in the coming week. Should this fail as support, the potential for further weakness back to the $76 level is likely and even deeper to the $72 which was last seen in Dec.
Further crude weakness is bearish the oil and gas stocks but is bullish for travel and leisure names especially airlines and the renewable energy stocks which tend to rally as oil sells : see sectors below
Sectors in The Week Ahead - Dollar Watch for Miners
In last week's wrap I highlighted the strength in gold as a precursor to a rally in precious metal minor stocks with a potential for spill over to the base metal miners. Precious metal miners were among the better performing stocks last week with twenty seven of the sector rallying while 19 sold - a plot of the sector is shown below for the week and the month with my pick from last week's wrap of Hochschild Mining of HOC being one of the better performers on the week +15.6%
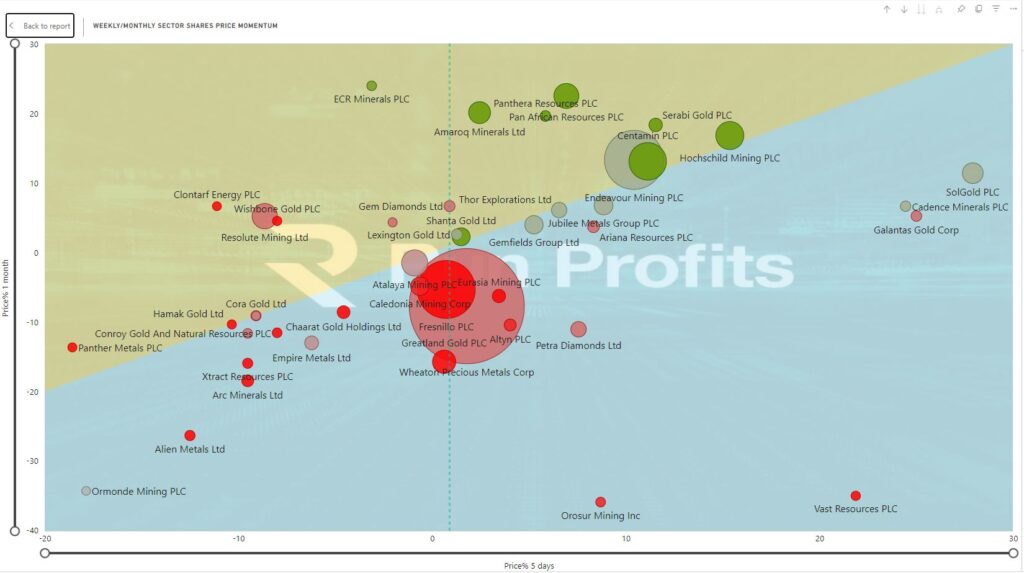 Precious Metal Miners Sector Performance led by a SOLG (reversal on news) , CAD , HOC , CEY
If dollar weakness does persist next week and strength is held in both gold silver with continued recovery in platinum then I would expect a number of these names to continue to recover - I will look to take some longs in a number of these names and will post analyses during the coming week. There are some potentially interesting reversal setups taking shape in the likes of THS, SLP, JAY
The stalwart outperformers held their course with Banks, Insurance, Utilities and A&D continuing to perform well : they remain the top 3 most bullish sectors across all timeframes with Consumer Services, Food Producers and . Construction & Materials showing similar strength Technology hardware and Healthcare Providers staged a recovery form the previous week's selling.
Leisure Goods, Personal Goods, Oil & Gas and Industrial Metals & Mining were among the weakest sectors this week. On a relative basis these also rank among the weakest sectors overall though Renewable Energy, Industrial Materials and Chemicals are the weakest sectors in the UK
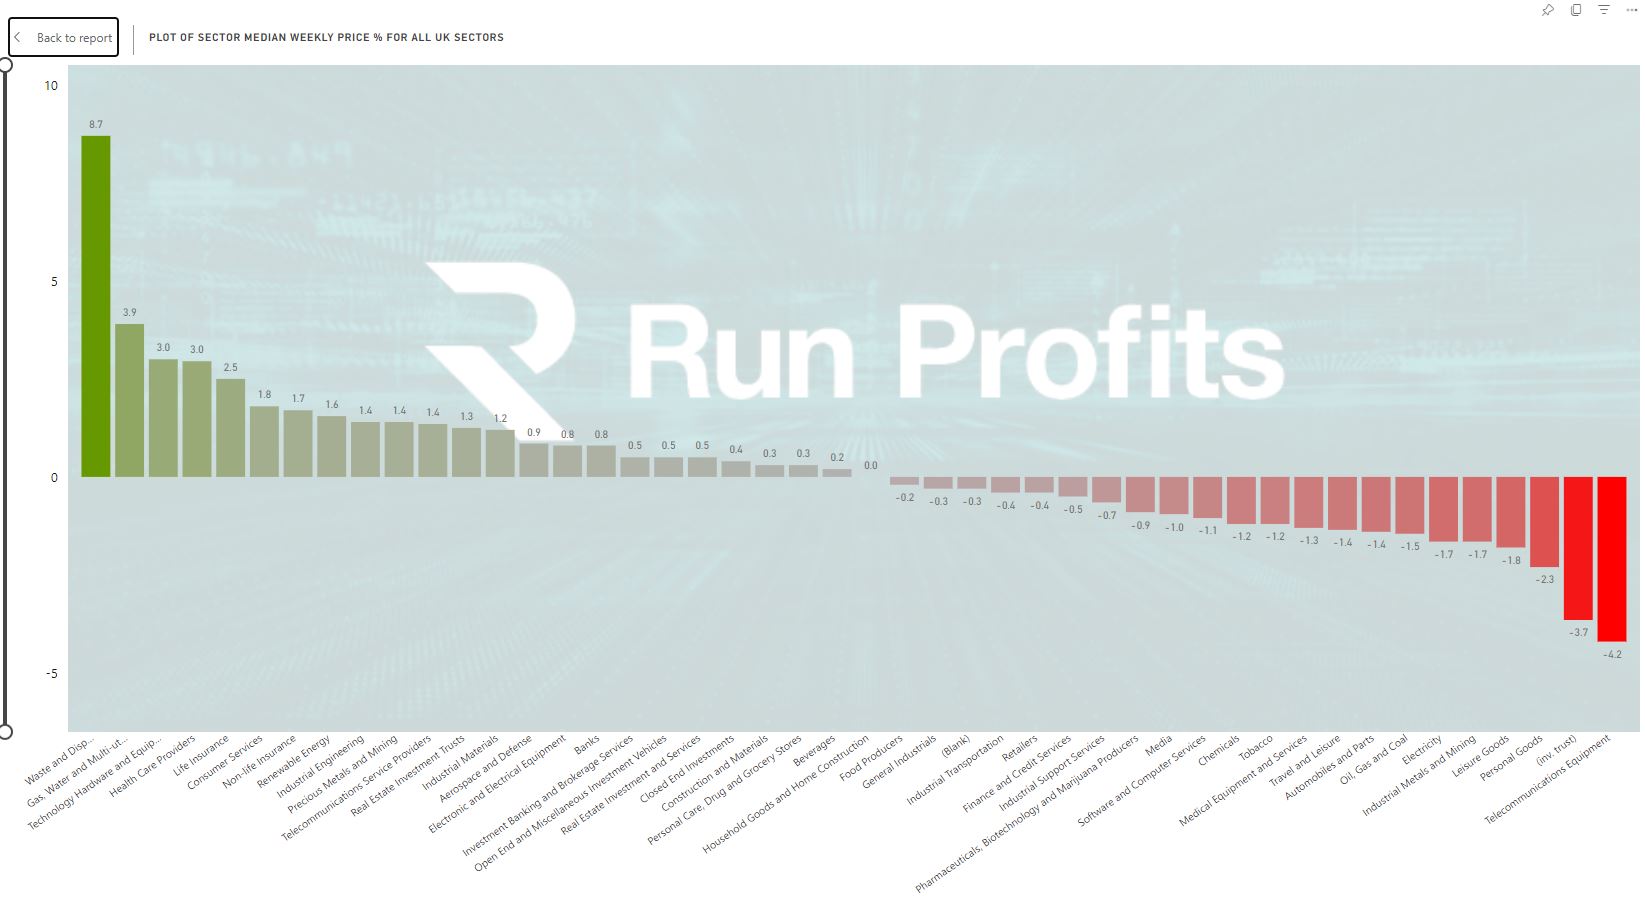
23 Sector Risers to 23 fallers led by Insurance, Banks, Utilities, A&D

Weekly Sector Momentum Plot
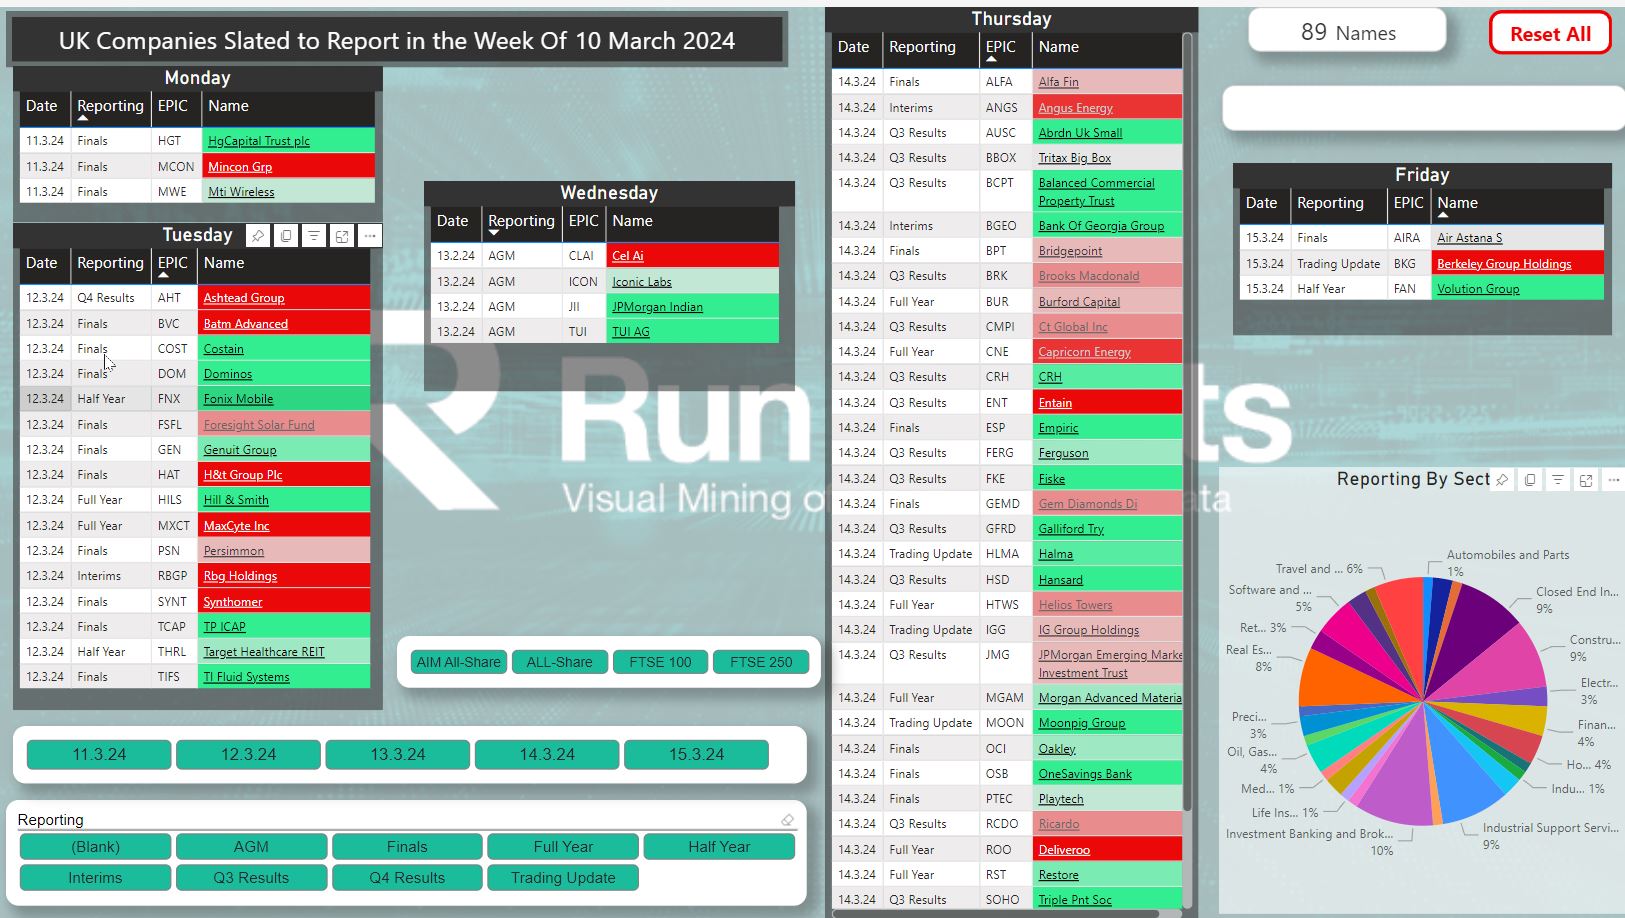
Earning and Economic Calendar Week 10 of 4 March 2024
89 names set to report in the coming week - see the RP Calendar here : screen grab below
5 Construction GEN CRH GFRD RCDO FAN
6 industrial Support COST MXCT RBGP FERG RST TRI
Screen Grab below - full details in the interactive calendar
Next week sees some big macroeconomic events including unemployment data, GDP and production data for the UK : German and US CPI , US retail sales , ECB meeting, and US PPI Thursday -see calendar