
Dollar and Commodities Copper, Platinum, Gold and Brent Charts
China (which was on holiday last week) is now back from holiday this week which may play out positively in the commodities complex especially gold which ended the week down 0.8% but significantly recovered from its lows of $1982 on Tues/Wed following the US CPI reaction – closing the week out at $2013/oz. Platinum also sold-off on stronger dollar retesting its recent multiyear lows, but has since rallied significantly. Silver has also staged a comeback while copper has also managed to recover all of its losses for the week and is back to levels from early February. Looking at the sector heat map below the relative weakness this week in both base and precious metals has played out in the mining sector which was further complicated by some disappointing results from the likes of BHP and South 32 .
My call in last week’s WW of potential reversals in SLP and FRES were premature and derailed by the US CPI surprise : while FRES made a measly 2.3% on the week: SLP sold off 4.5% , despite reporting a 10% increases in mineral resource estimates Friday : the trend remains your friend util the bend in the end. Thankfully calls in ARB here (+12% ) CYAN here on Mon (+8.8%) and NWG Friday here +7.1% intraday Friday to hit my interim target following an open gap down and JoB buying opportunity - I also posted a Gold long from $1995 which hit target 1 of $2013 - posted here
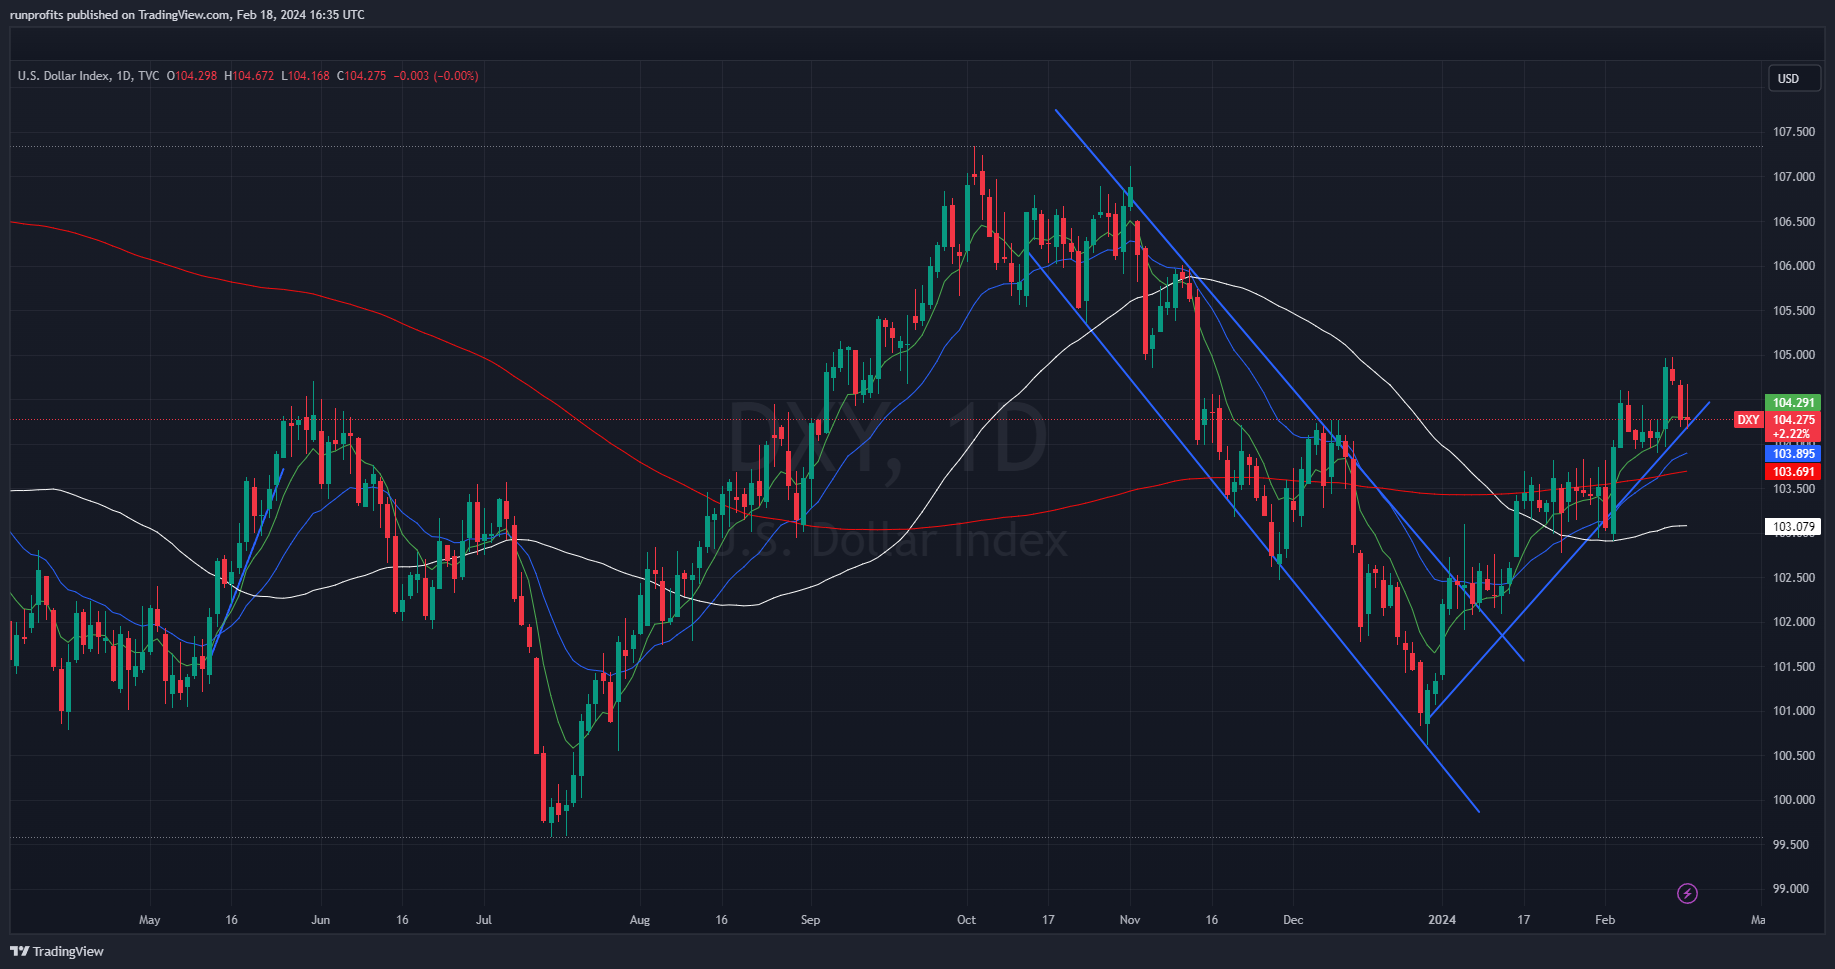
Dollar pullback from the $105 post CPI high
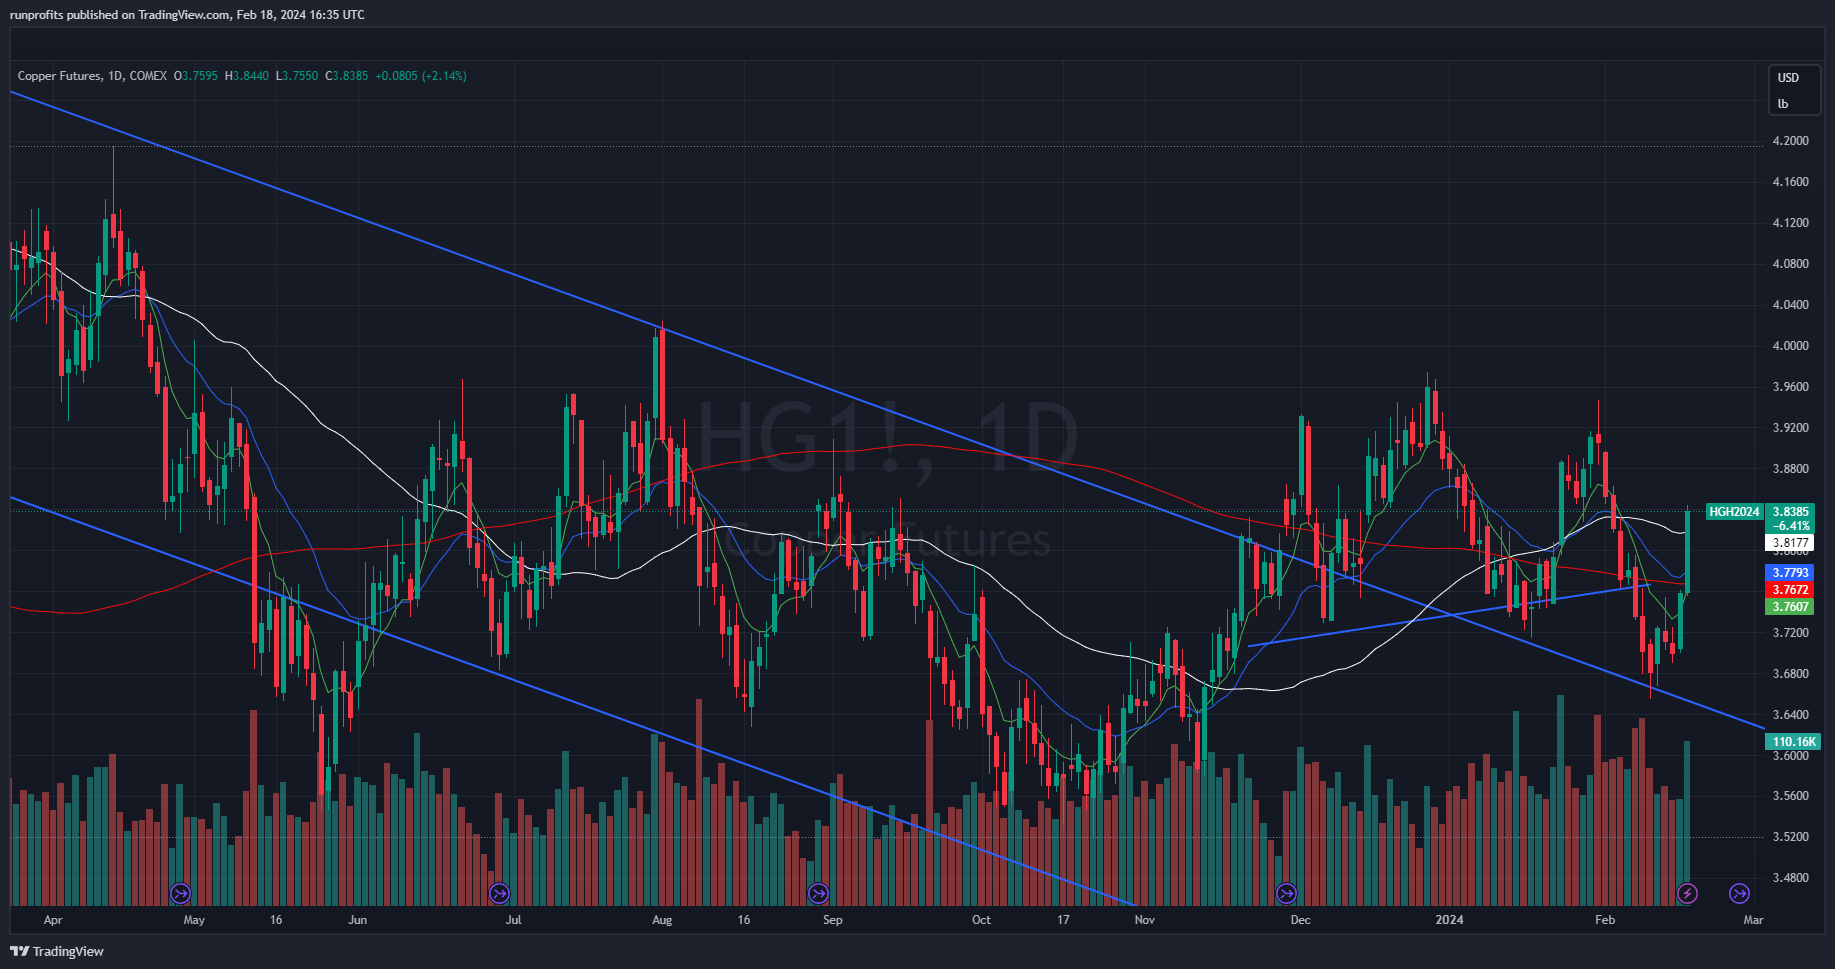
Copper finds support and rallies - watch the Copper miners for a lift in the c0ming week
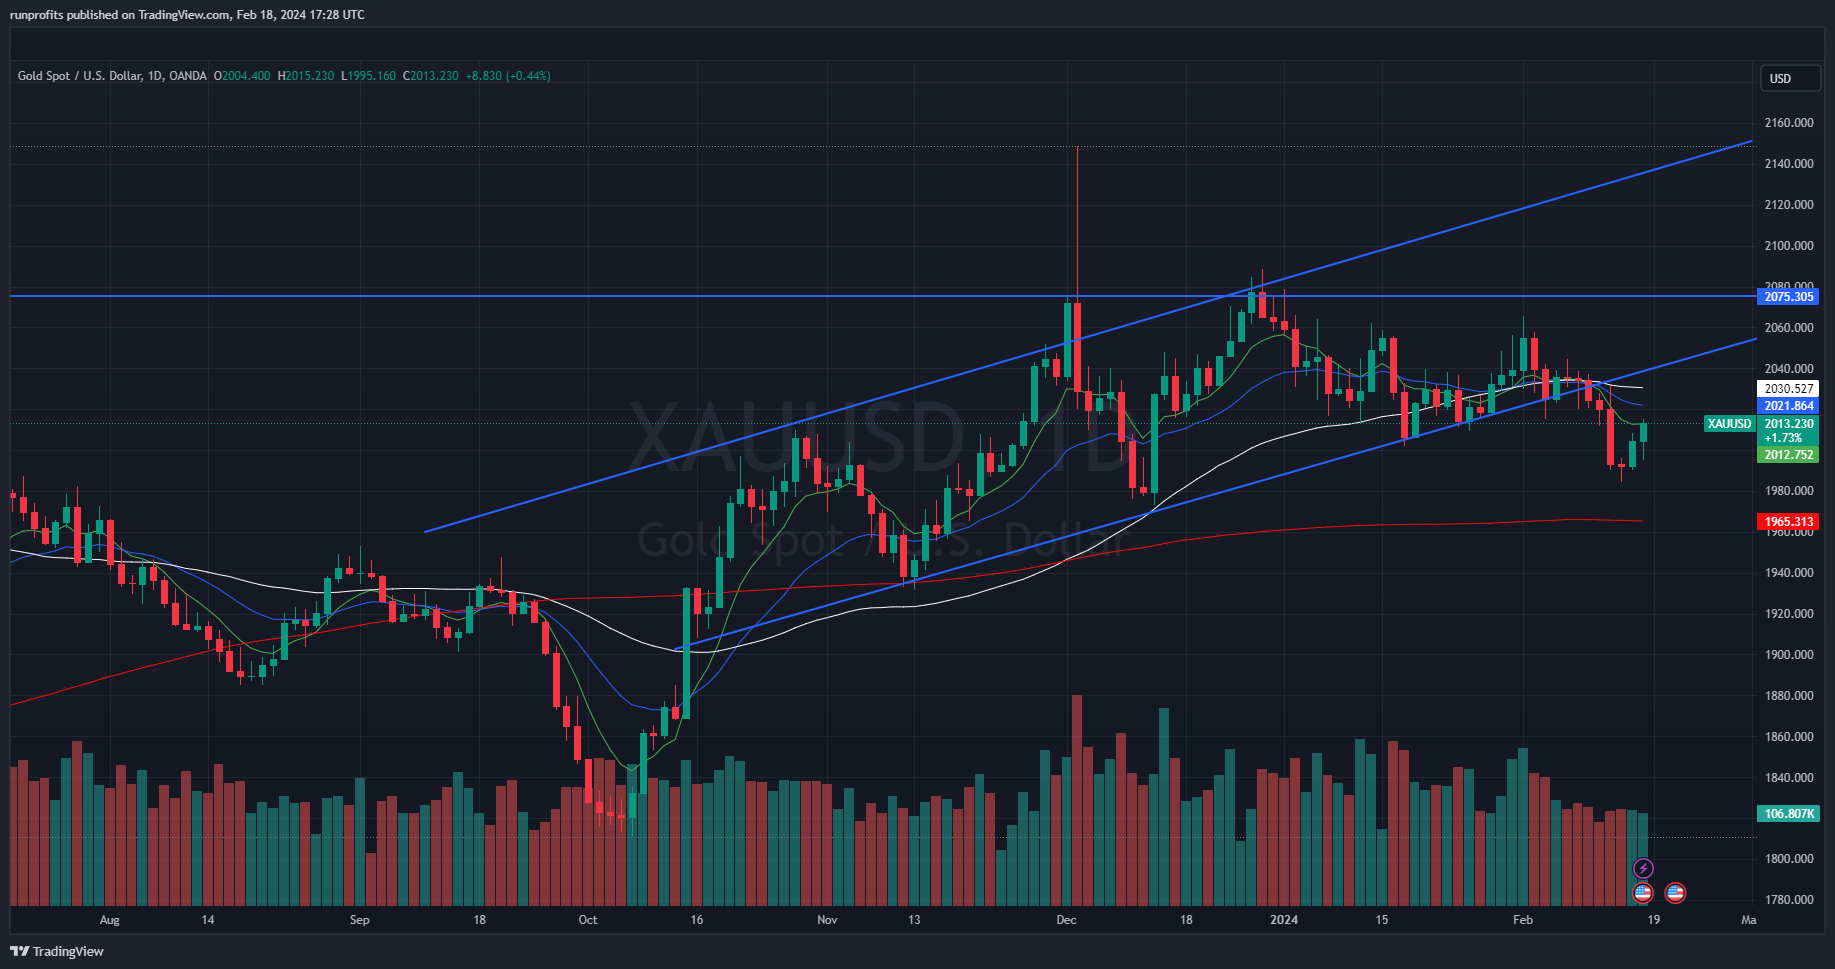
Gold rallies off a low to resistance around $2013 - likely to sell back from here if dollar reasserts strength
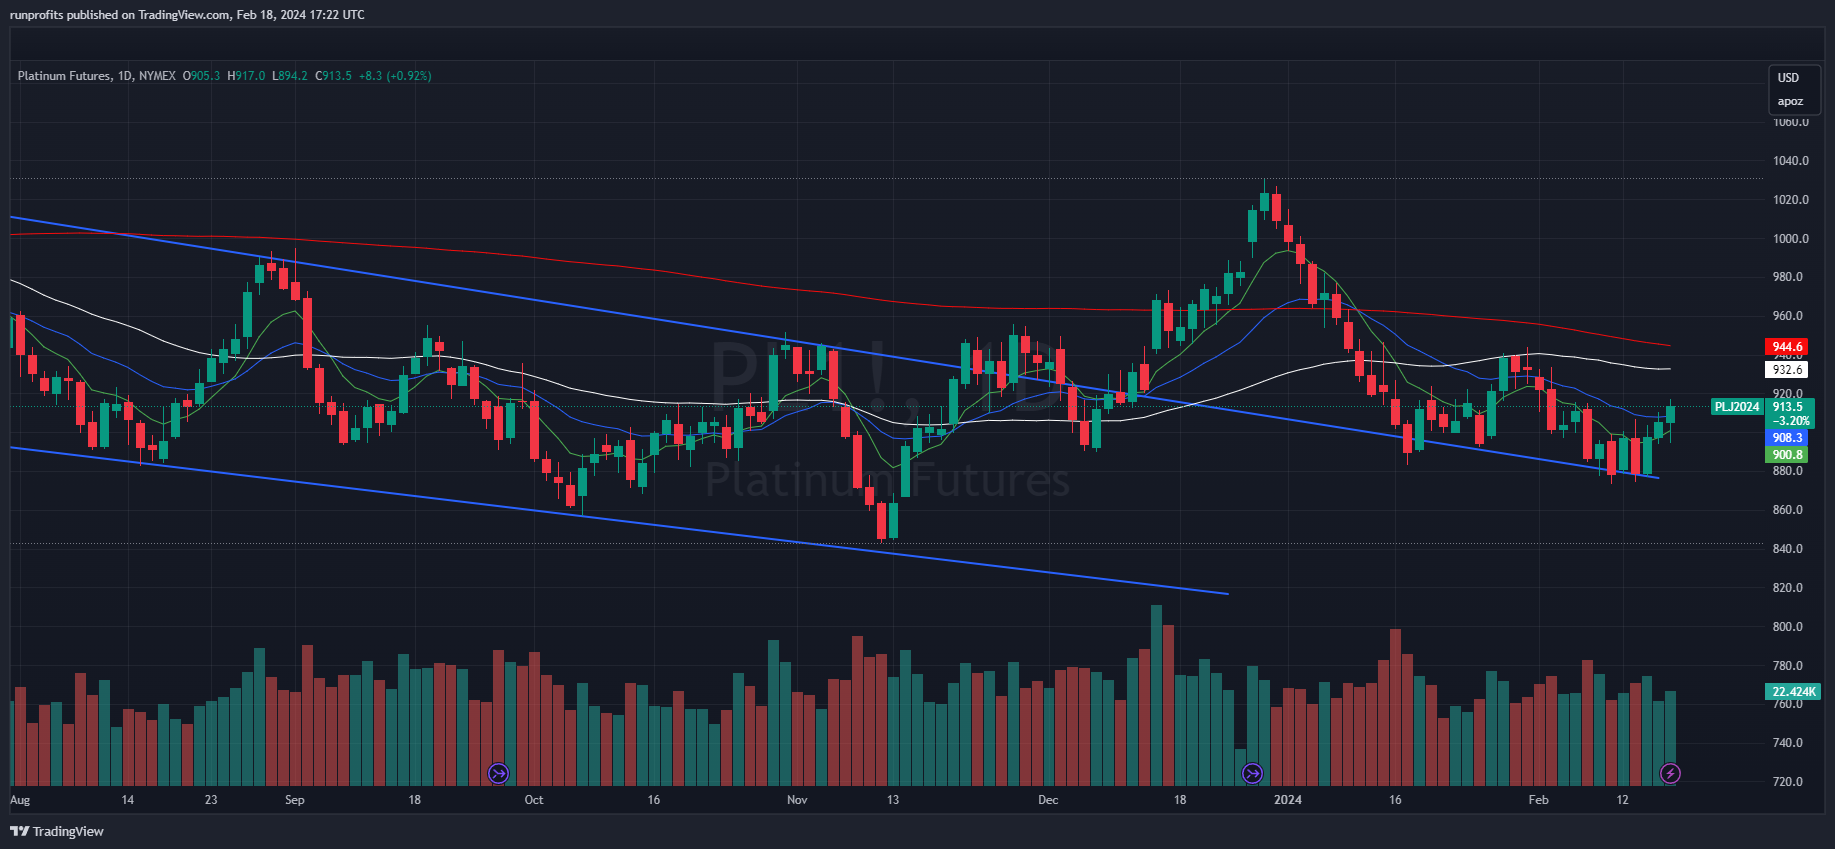
Platinum probes previous low and bids
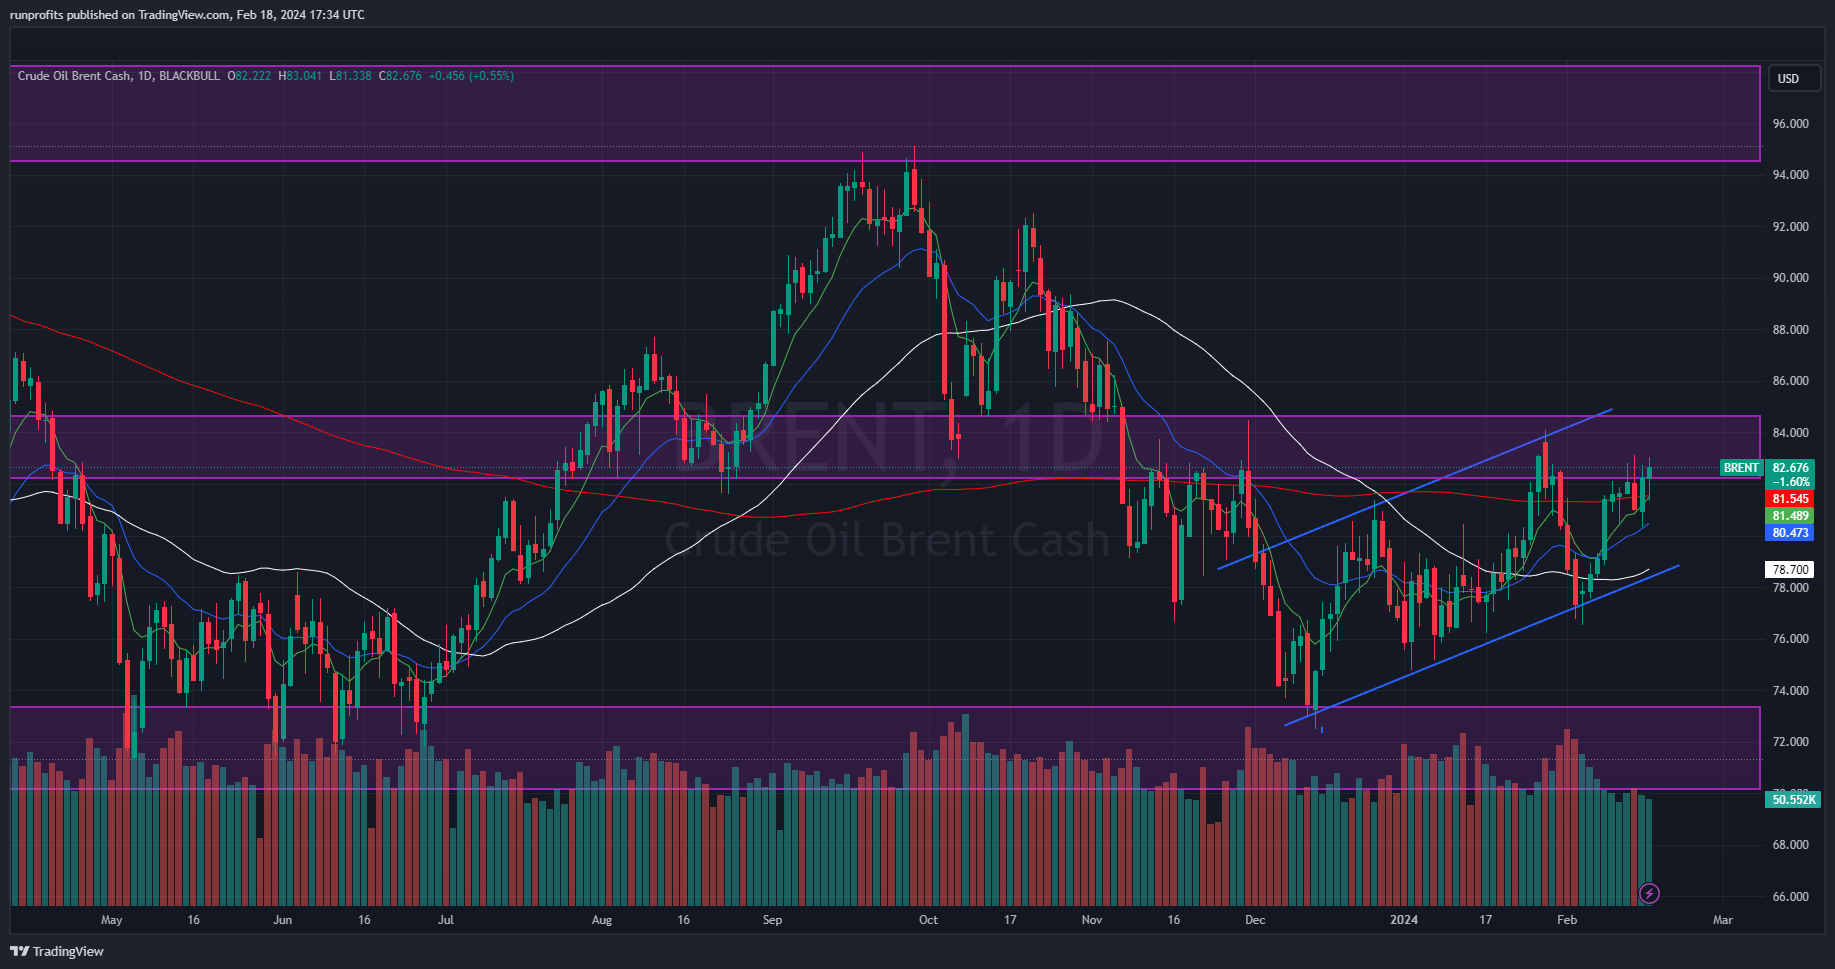
Brent Crude back at resistance and prone to sell off /pull back from $83 level
Brent crude Continued to show strength early in the week however an inventory build in the EIA data on Wednesday caused oil to sell off below the 200 MA c chart which continued into the Thursday dipping to the 21 EMA( blue line in chart] before rallying back on Friday to resistance With an area of overhead supply shown in the purple box on the chart. Oil remains broadly in a channel
Sectors on the Moves
In sectors – 27 of the 41 sectors were in Green this week which saw particularly good performance in Telecommunication Service Providers, Consumer Services, Personal Goods, Banks, Retailers, REITs and Utilities with even the Travel sector catching a bid. Oil and Gas also finished the week in the green with 46 names up on the week while 37 sold off.
Renewable Energy is once again the worst performing sector as it was last week miners industrial materials leisure goods and particularly precious metal miners also underperformed this week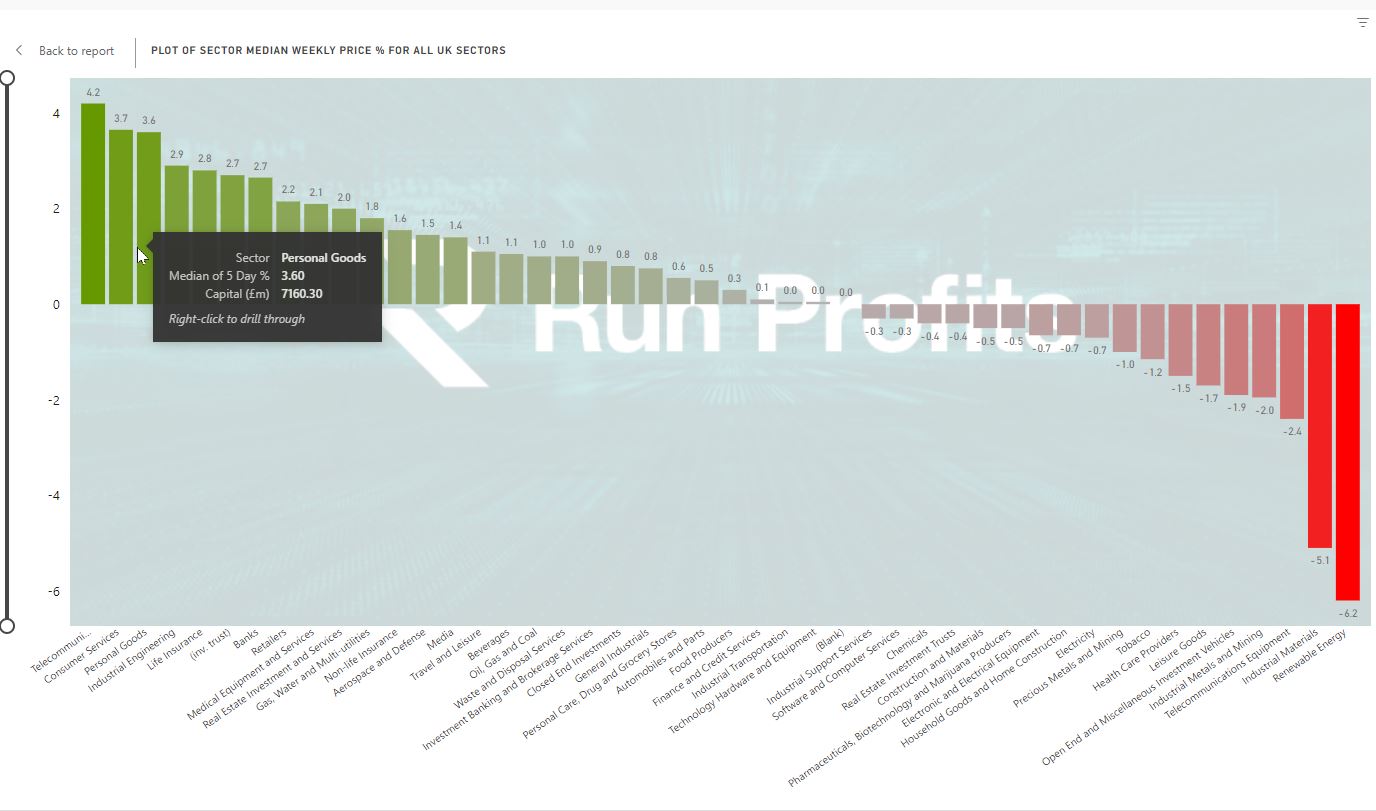
Sector Winners and Loser on the Week
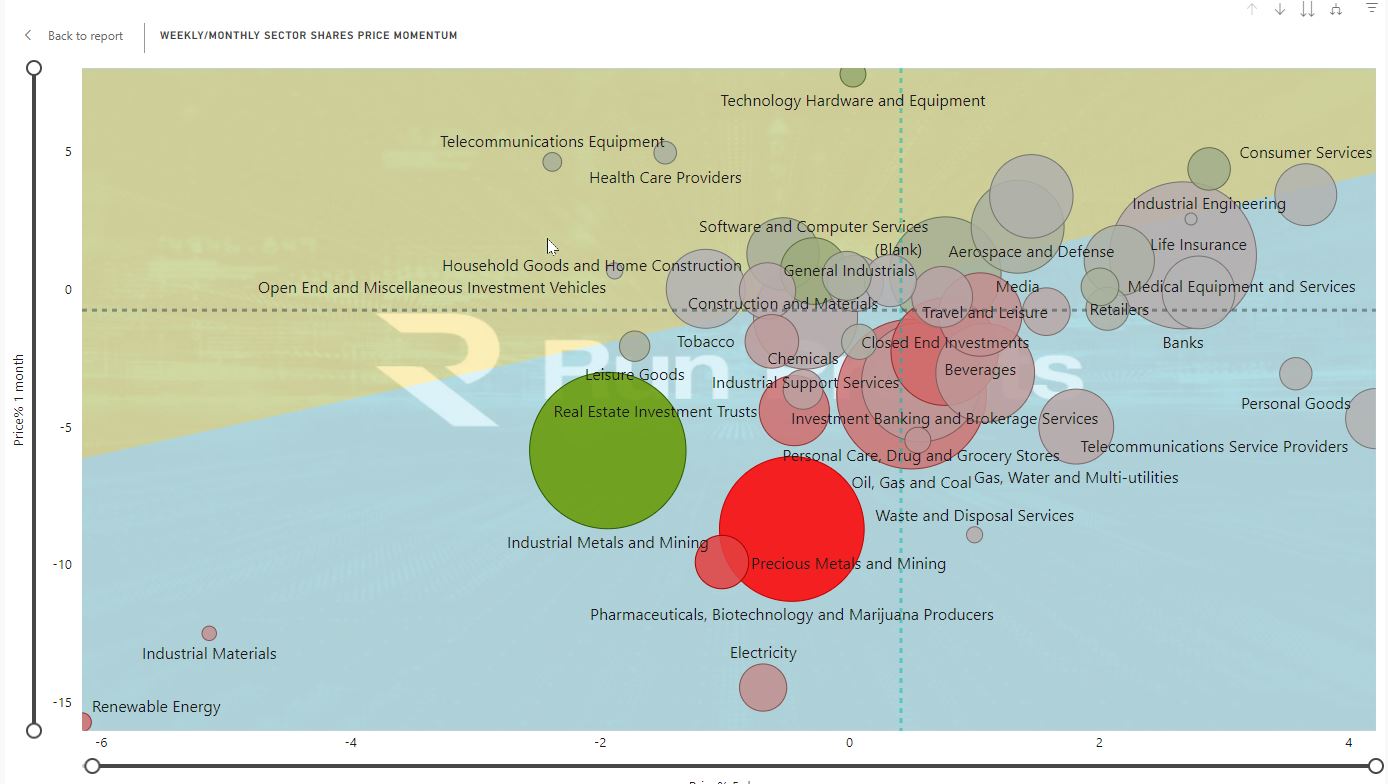
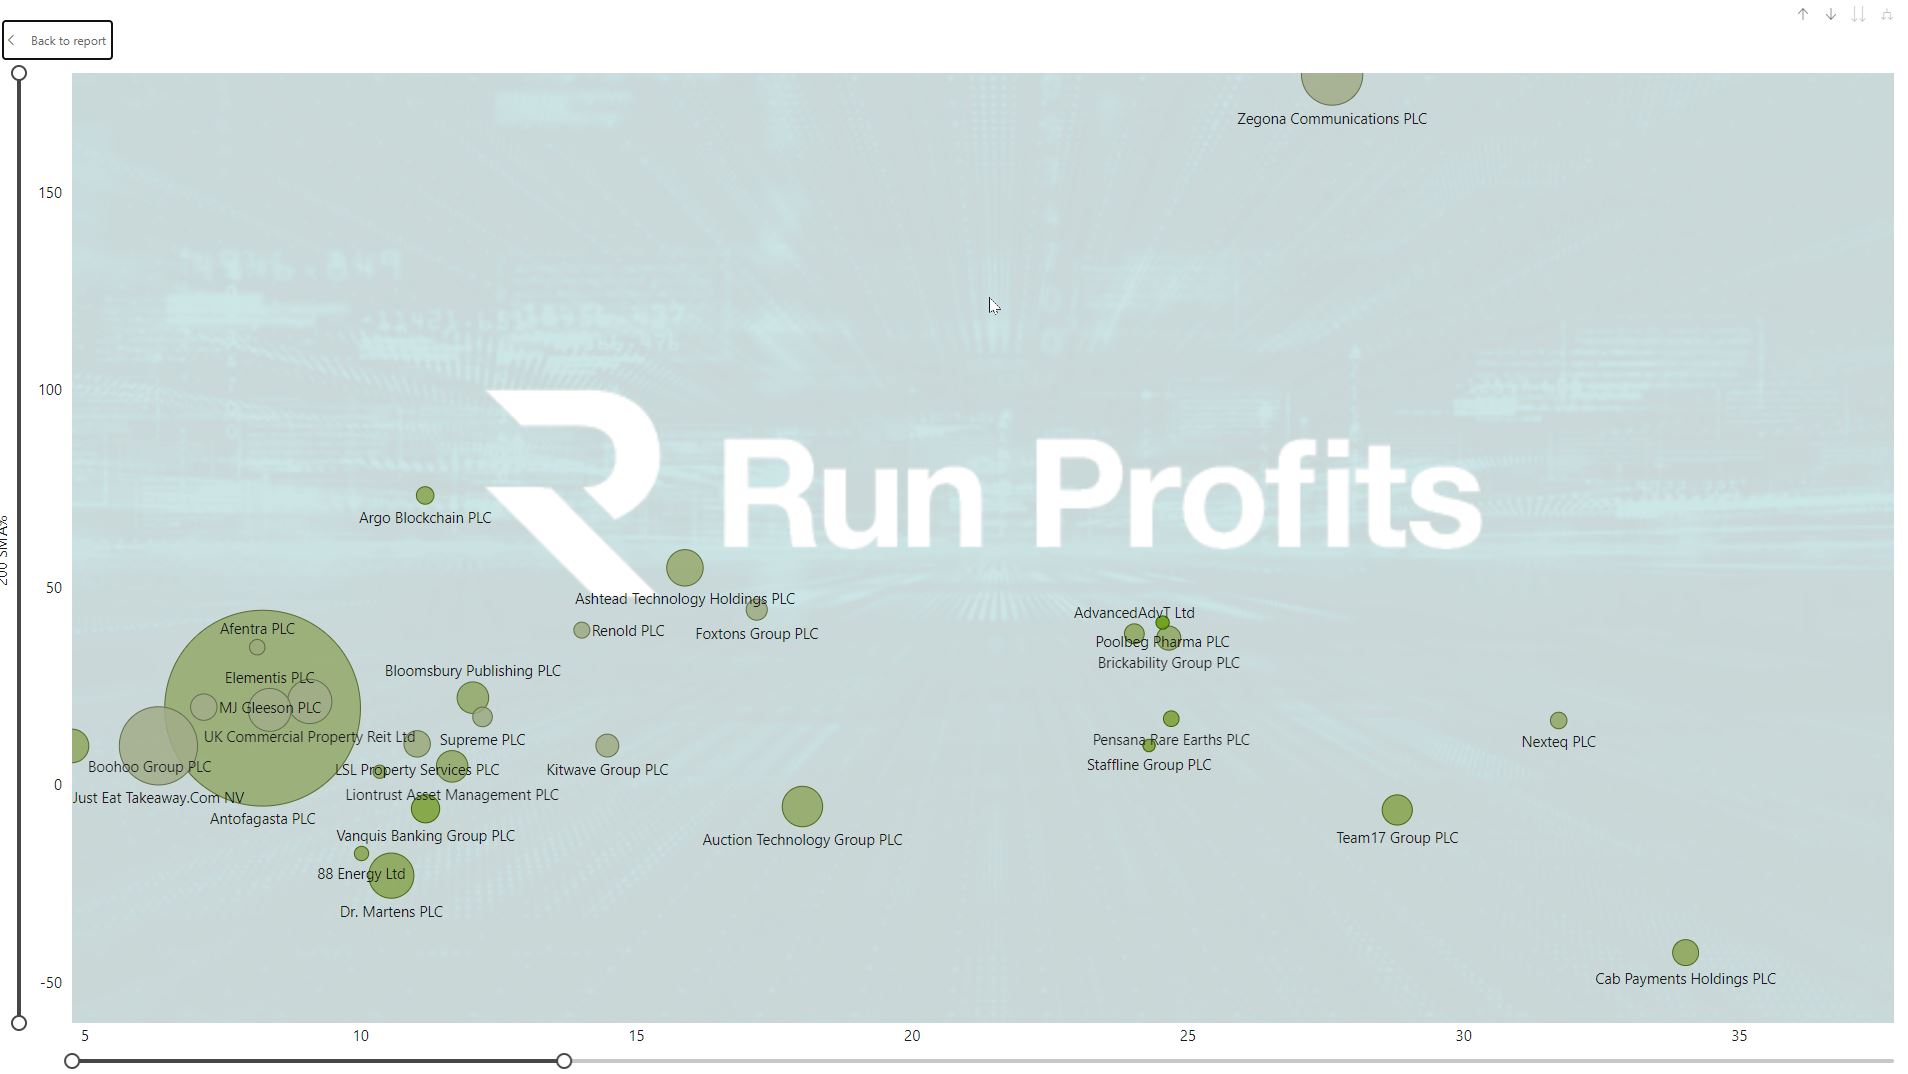
Sector Momentum Weekly and Monthly - Strength in the Upper Right
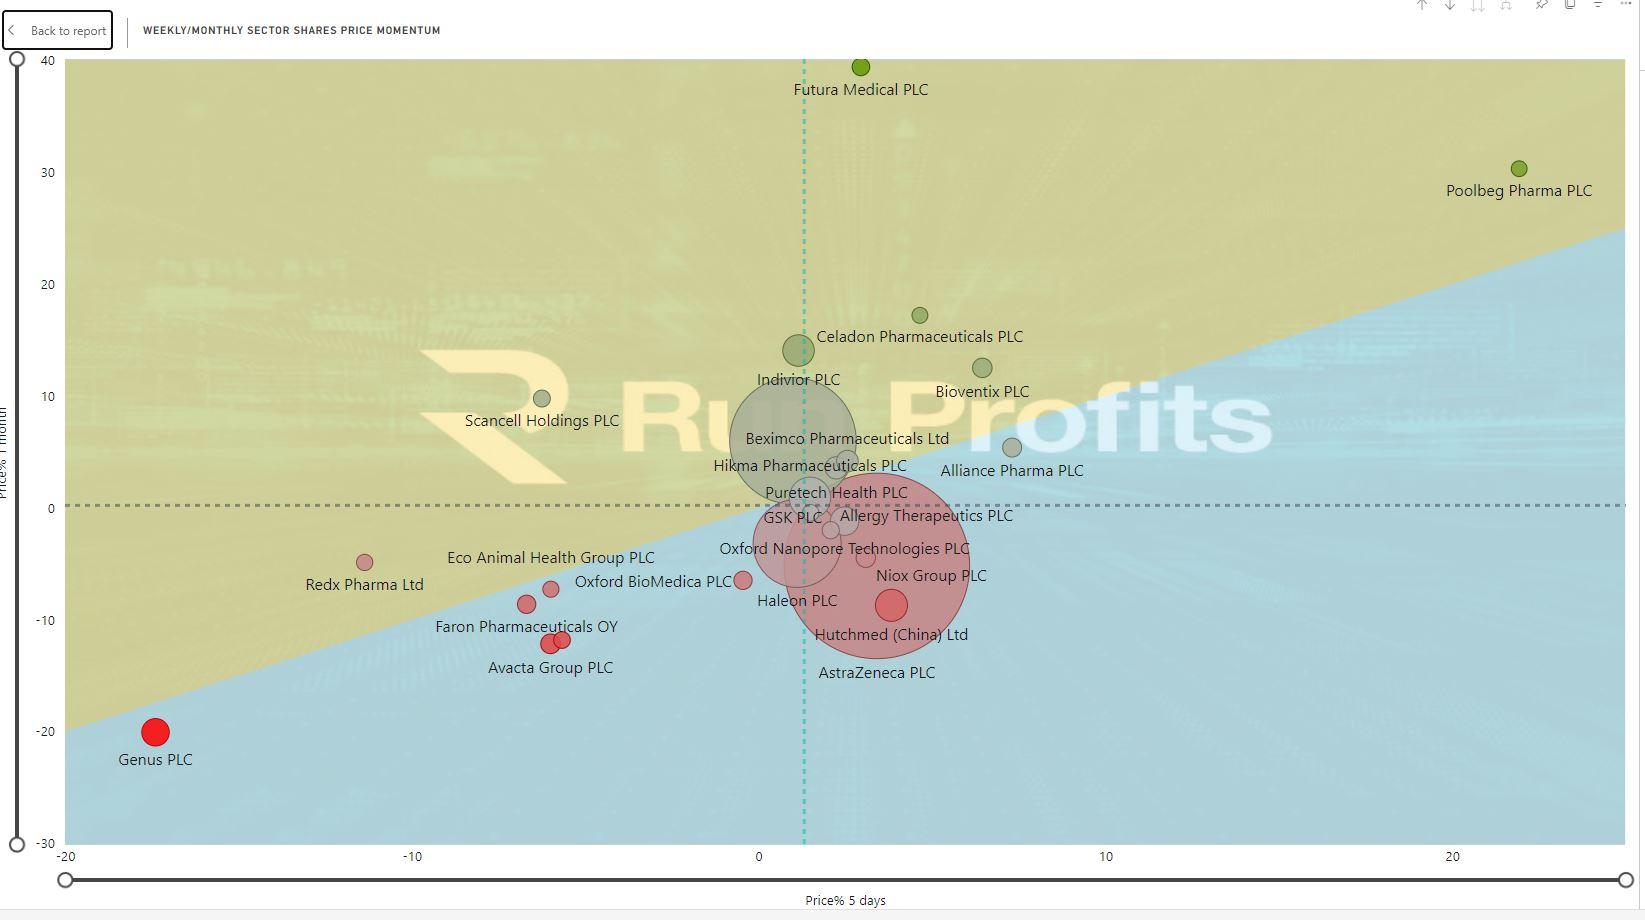
High Momentum Names: Sector Highlight : Pharmaceuticals and Biotechnology POOLB , INDV , FUM
In the high momentum names POLB made the biggest gains on the week up 22% with PRE in second at 15.8% STAF VANO TM17 ARB DOCS CABP AXL ADVT ATG BRCK HE1 BOO all made double digit gains on the week- see table
The best way to play these is to look for pullbacks from extended names - A new Help video has been added to the RP trade scanner section which shows how to use the scanner to find opportunities and to do some analysis using charting this can be found here
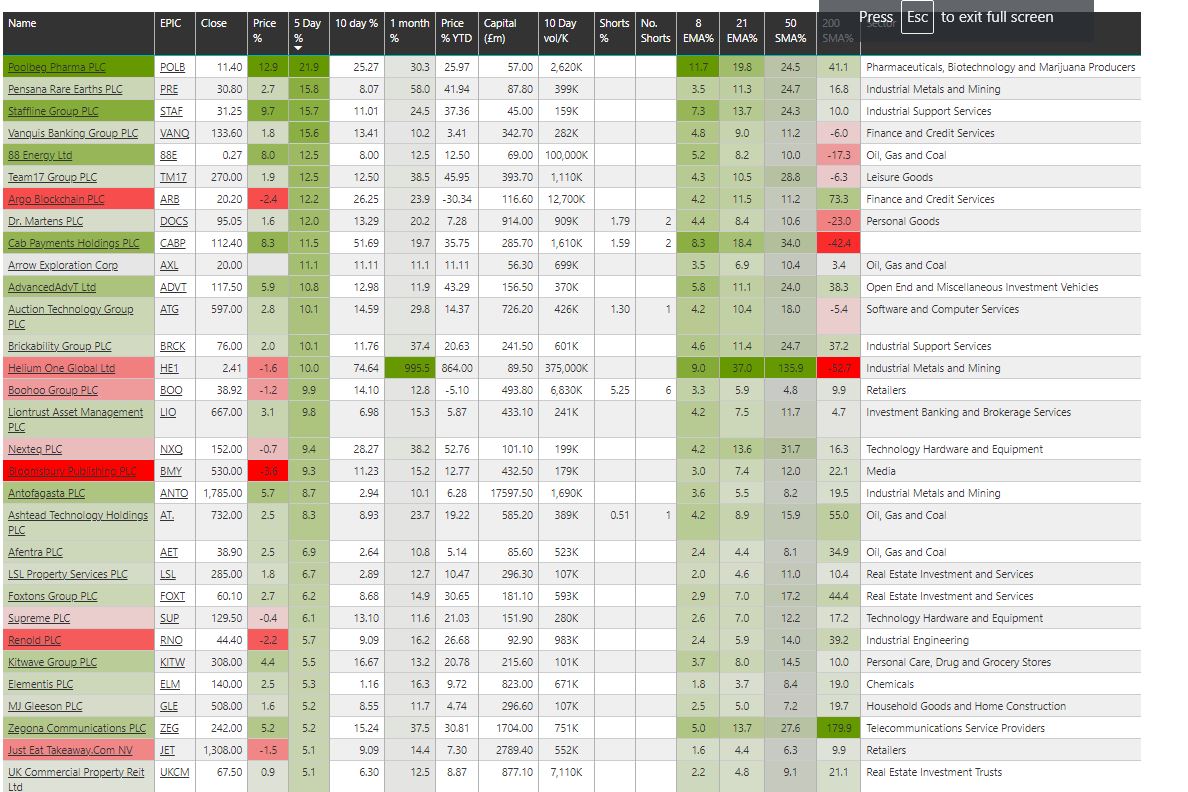
Poollbeg Pharma rallied 13% Friday on strong volume adding to recent strength This is now the sector leader over the past week and month making multiyear highs. It’s one to watch and get on board with though I’d be inclined to wait for a pullback before entering.
I am long Futura Medical FUM which is also up significantly over the past month.
A Weekly/Monthly sector plots is shown below Over the coming week I will highlight a few Trade idea opportunities opportunities within this sector as a number of these are setting up for breakouts
INDV Especially has a bullish chart which is showing a cup and handle pattern with a volatility squeeze on the handle from fairly tightly clustered moving averages. This is often the precursor to a breakout. Individual is set to report on Thursday 22nd of February- this is likely the catalyst required and the chart would suggest that this is a positive catalyst and will trigger a breakout long. It is an individual choice in advance of earnings whether to wait for the price reaction or to position in anticipation of that reaction. In the case of the latter, it’s often prudent to use a smaller position size and then add to this in the event of a positive reaction
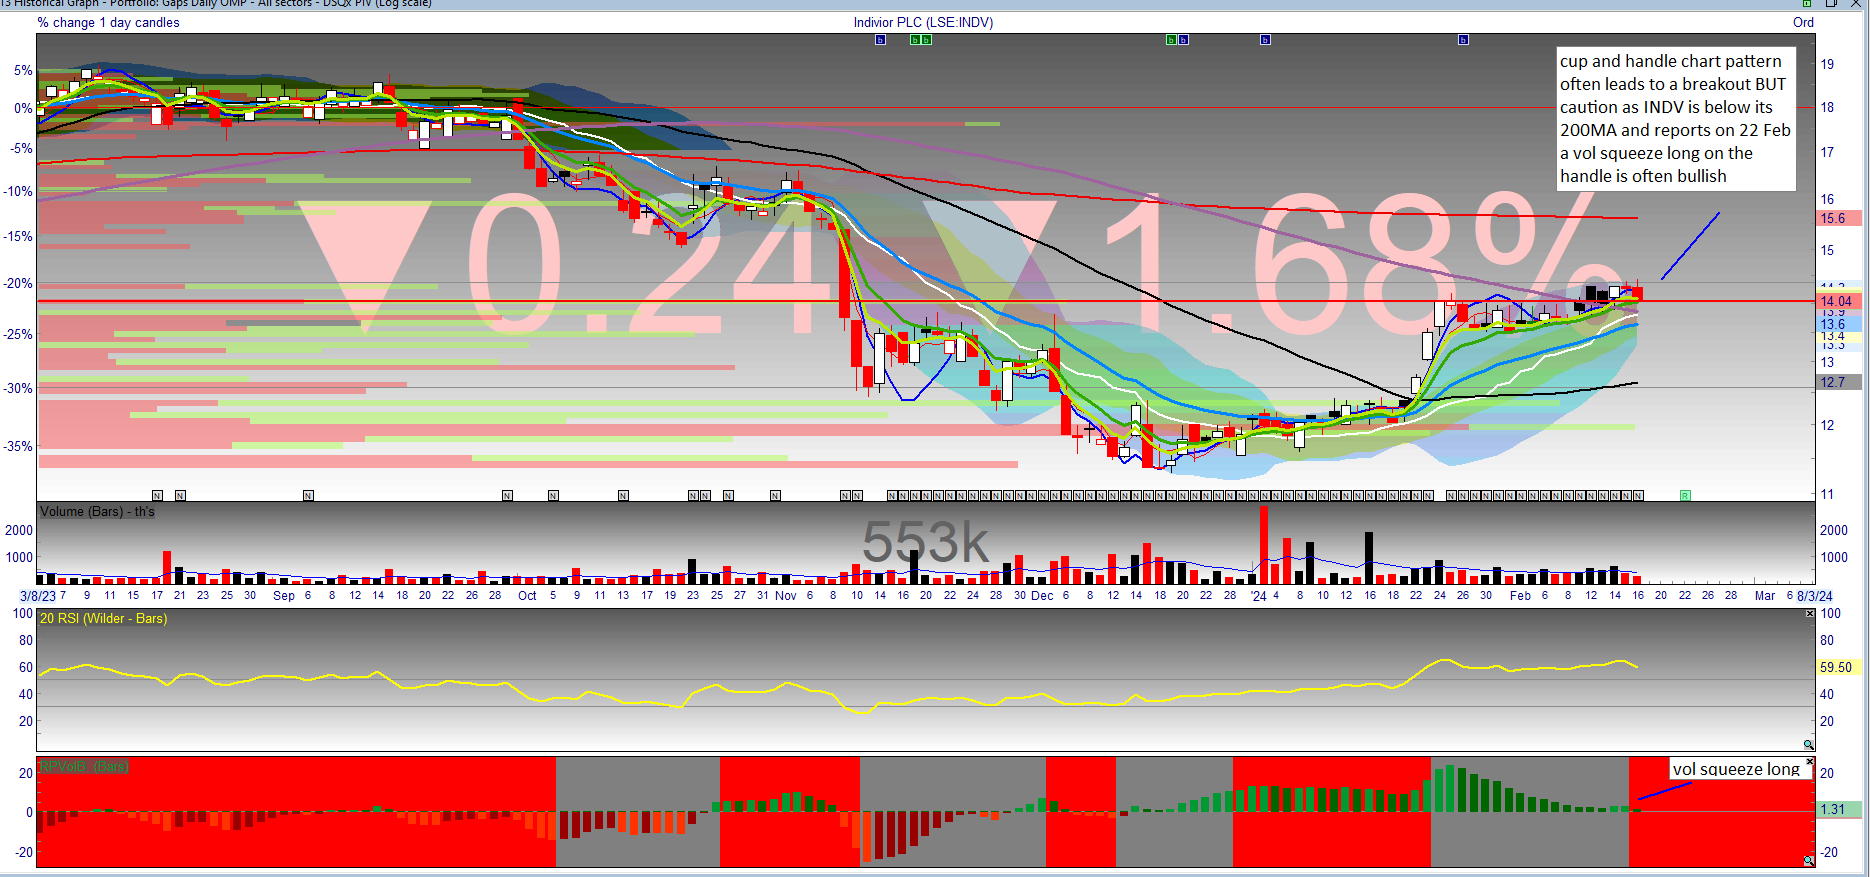
Indivior showing a bullish chart pattern into results on 22 Feb 24
Earning and Economic Calendar Week 8 of 19 Feb 2024
73 names set to report in the coming week - see the RP Calendar here : screen grab below
6 Miners ANTO BHP on Tuesday, GLEN , RIO Wednesday, AAL Thursday , FXPO Friday
6 Banks reporting including BARC, HSBA LLOY VMUK, STAN
3 Pharmsa-HIK,INDV, 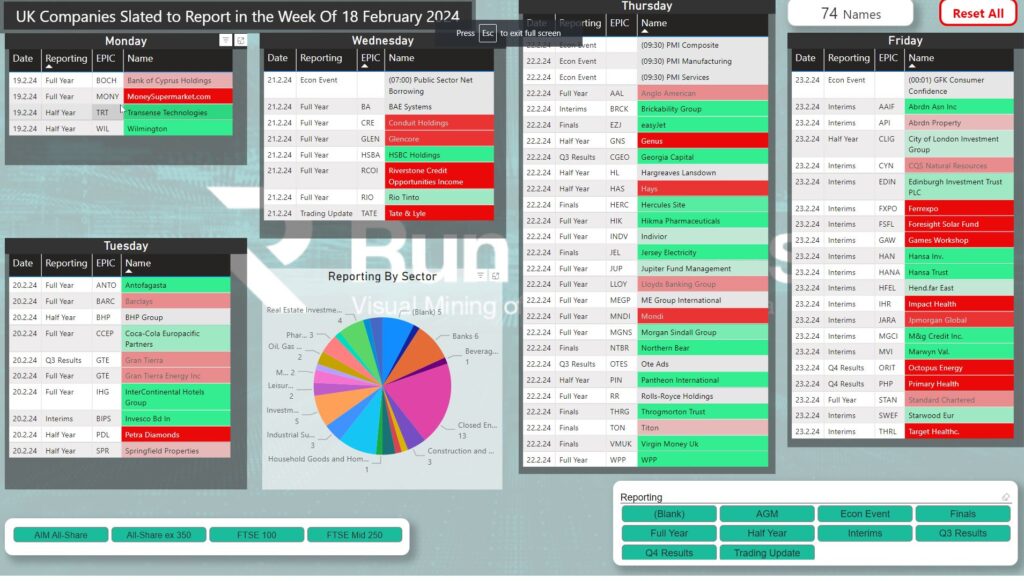
A Look Through the Indices
A green week across the board a the FTSE100 made a monthly high intraday on Friday closing the week up 1.8% followed by the AIM All-share up 1.6% on the week with the mid caps lagging but in the green to 0.9 % on the week.
There was a significant amount of economic data announced in this week with average earnings in the UK coming in slightly higher than expected, unemployment claimant count lower than expected while inflation in the UK came in slightly lower than expected which helped boost overall confidence with a CPI of 4% versus expected 4.1% YoY. This was in contrast to the US disappointing on CPI on Tuesday and causing a spike in the dollar which weighed heavy on the commodities .
By contrast UK PPI was significantly lower in January impacting the annual year on year to minus 3.3% from an expected minus 3%. GDP Data on Thursday confirmed that the UK had indeed slipped into recession in December of 2023: though this came as little surprise. What was a surprise was the significant increase in retail sales in January with a 3.4% versus a 1.5% expected.
Despite the mixed nature of some of the economic data this week the overall effect on the UK markets was pretty positive and seems to indicate a sense that the worst may indeed be behind us. This likely sets us up for some more positive moves.
A chart of the dollar index below shows the DXY broadly supported by the 8EMA ( green line in chart ].
Dollar Daily Chart - Click to enlarge