
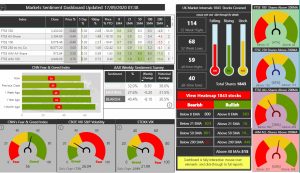
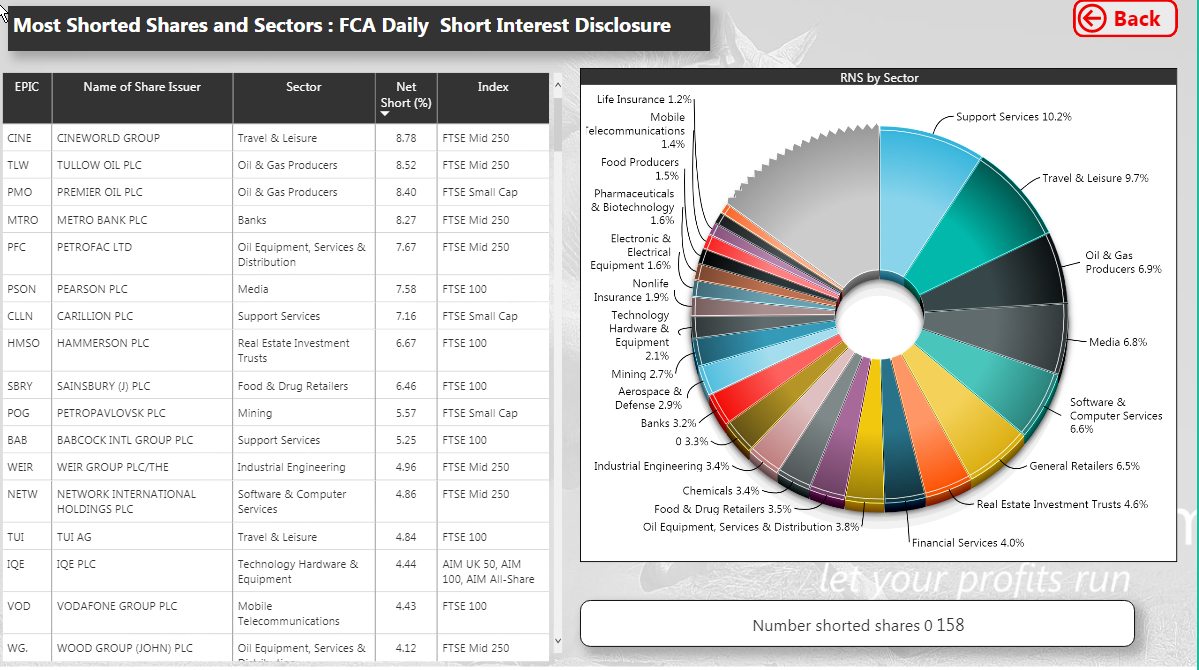
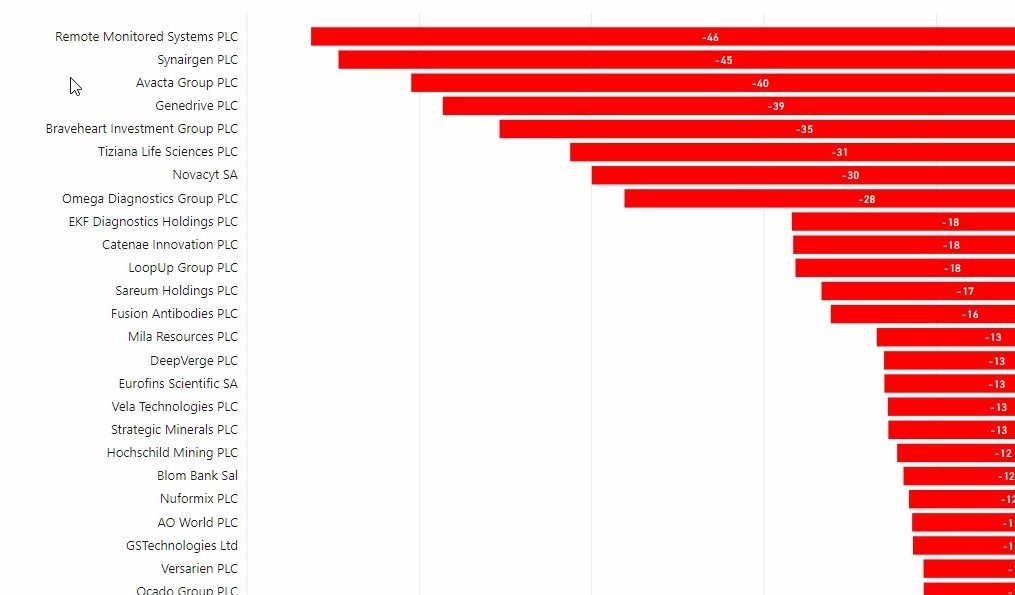
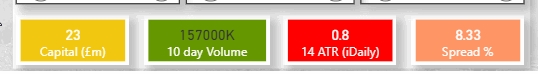
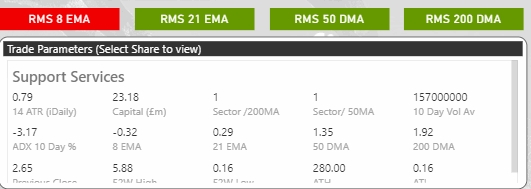
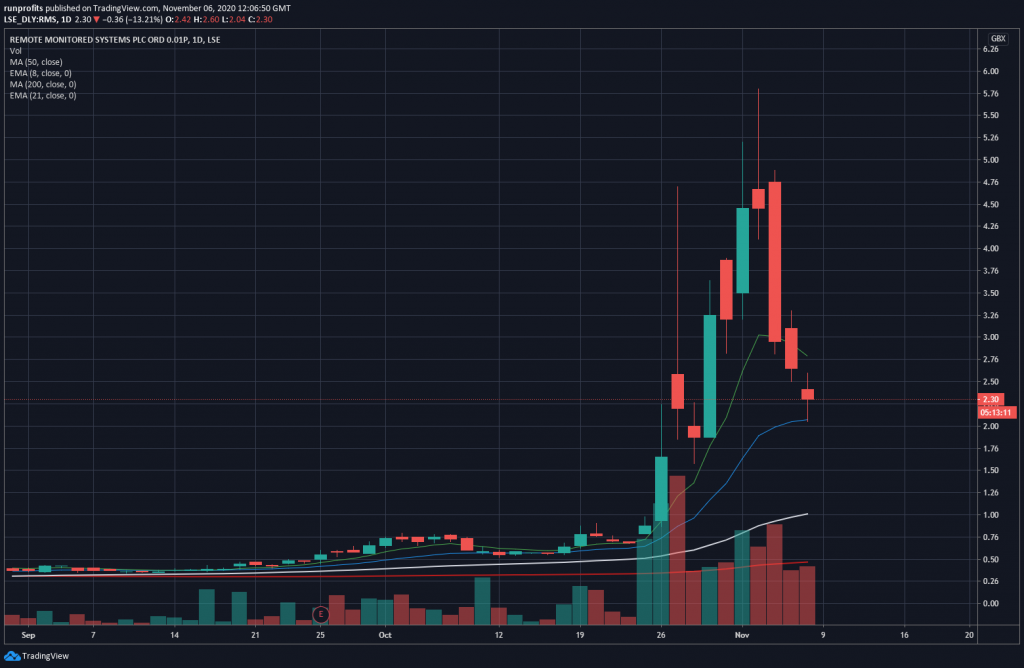
Market Sentiment Dashboard: Find Shares Rising/Falling and Strongest Trends
make money by trading with the trends using top-down data-driven analysis
our dashboard helps you to find shares making new highs and new lows against a backdrop of the overall market performance and sentiment
the right trades at the right time in the right way
click to view the report

Video Guide to Market Sentiment Dashboard
Detailed guide to help you unlock the power of the dashboard's analysis

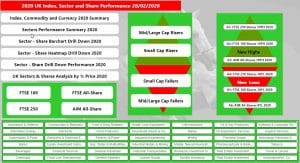 2020 So far for UK Indices, Sectors & Stocks. UPDATED Every Friday EOD
Interactive data report of performance across major UK assets classes YTD with individual sector breakdowns
Click to view
[stock_market_widget type="inline" template="generic" assets="AAL.L" markup="{name} ({symbol}) {price} ({change_pct}){last_update}" style="font-size:x-small" api="yf"]
[stock_market_widget type="inline" template="generic" assets="AAL.L" markup="{name} ({symbol}) {price} ({change_pct}){last_update}" style="font-size:x-small" api="yf"]
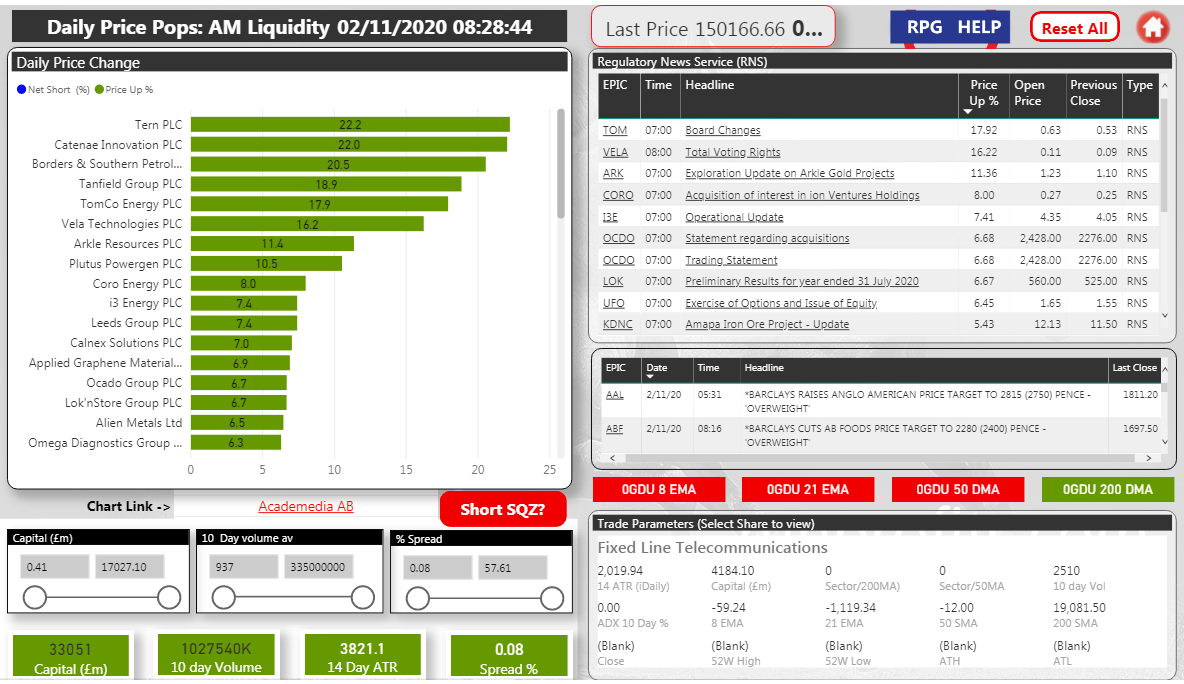
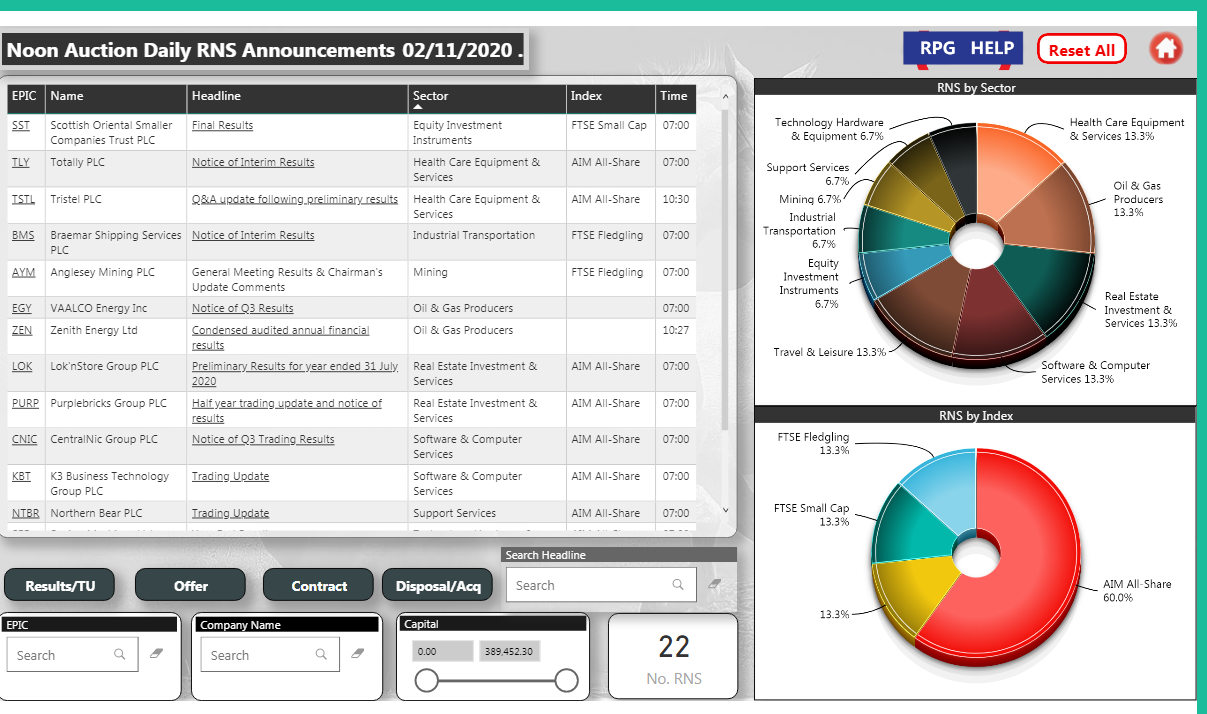
click on the + to the right to expand the charts in the below tabs
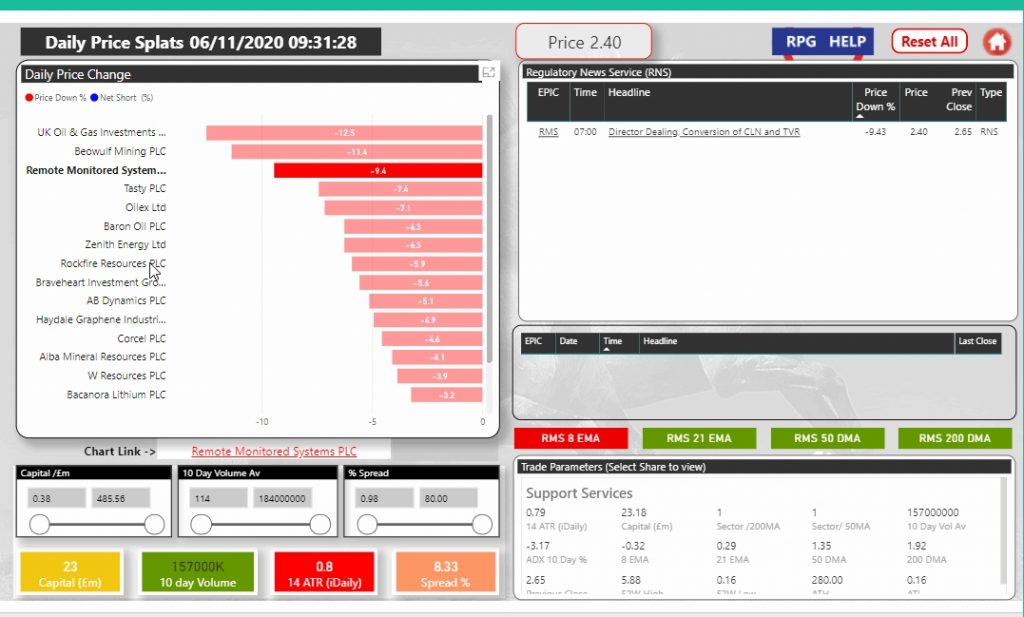
Select Report by Tab: If Report Appears Incomplete Hit “Reset All” to Refresh