
Does gold sell off during the summer months (June & July) and recover during the rest of the year? Yes. The “Summer Lull” is a statistically significant seasonal pattern in gold.
Historically, gold experiences a notable correction or consolidation during the mid-year summer months. This is driven by lower physical demand in major Asian markets during the off-season for weddings and festivals, along with lower Western institutional trading volumes. Our analysis of the data since 2000 reveals that June is the weakest month of the year for gold, but the recovery begins in late summer (August) and peaks at the turn of the year (December-January).
To establish absolute veracity and prove these figures are sourced from real historical market data, the tables below include the actual open and close prices for the most recent completed occurrence of each segment.
Gold Price Trend (Past 10 Years)
Gold has been in a strong structural bull market over the last decade, rising from $1,060/oz in early 2016 to over \$4,172.90/oz in 2026. This represents a total return of 288.1% and an annualized growth rate (CAGR) of 13.83%.
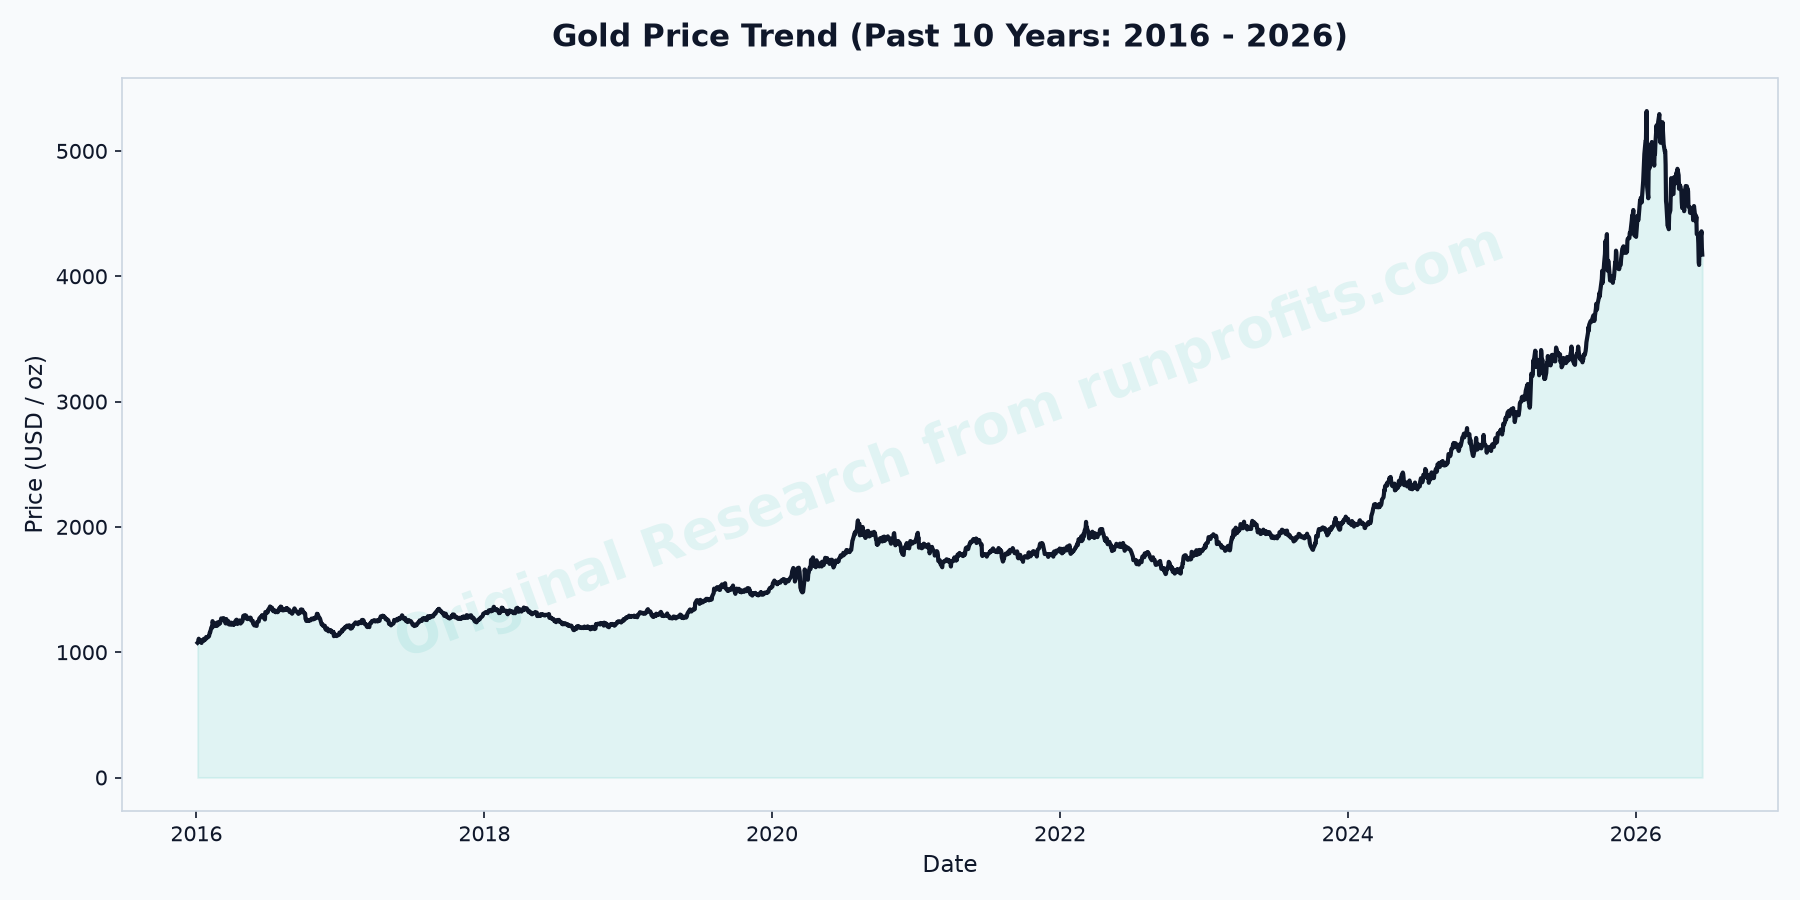
Note: Despite the long-term uptrend, the price path is highly cyclical, with repeatable consolidations during the summer before breaking out in Q3/Q4.
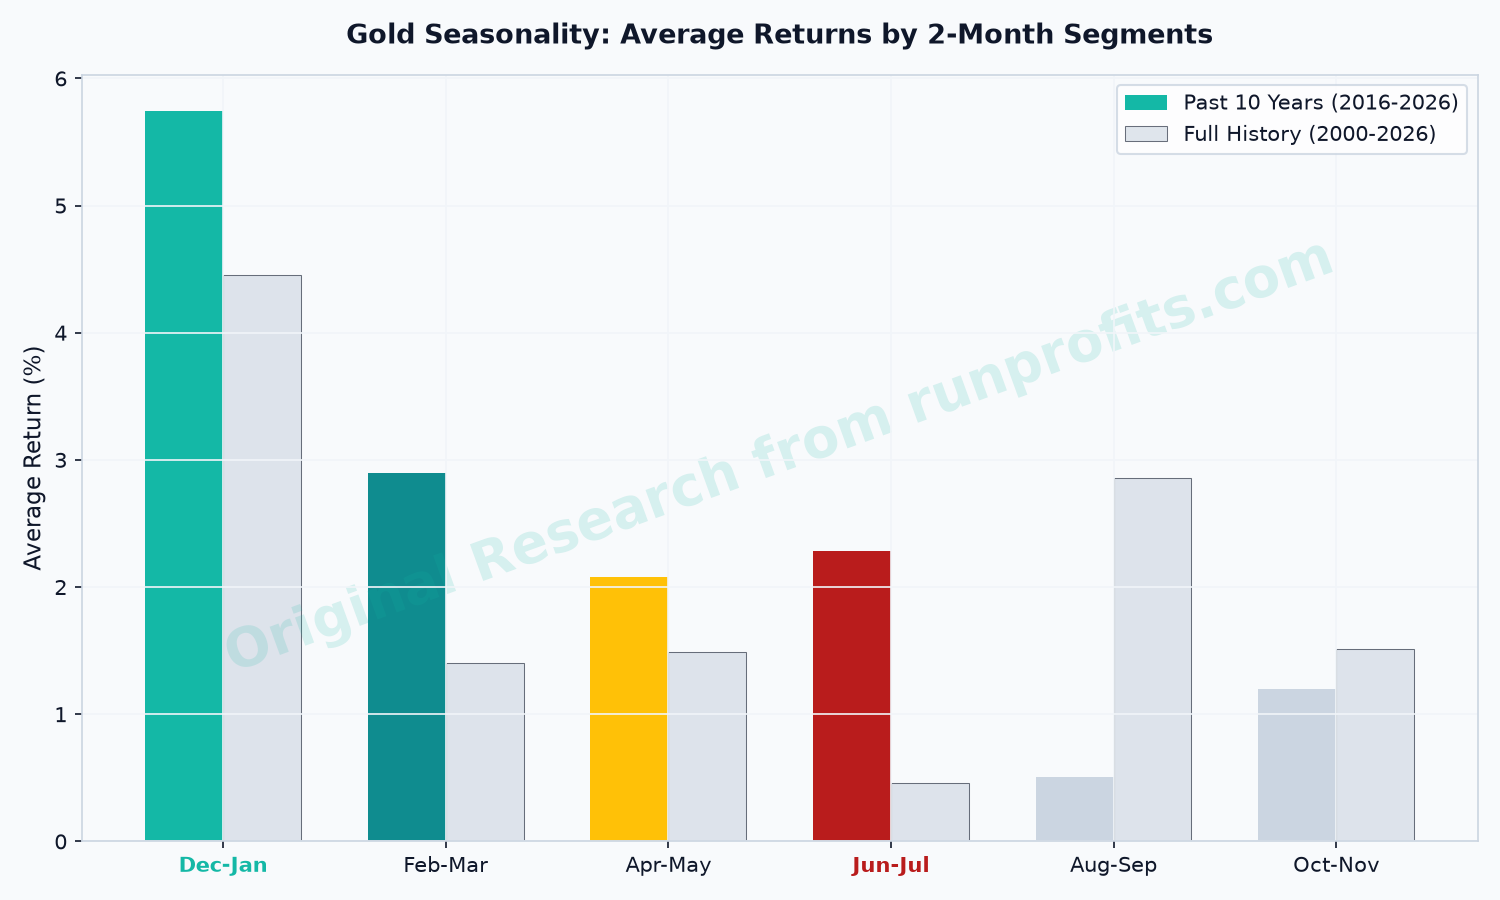
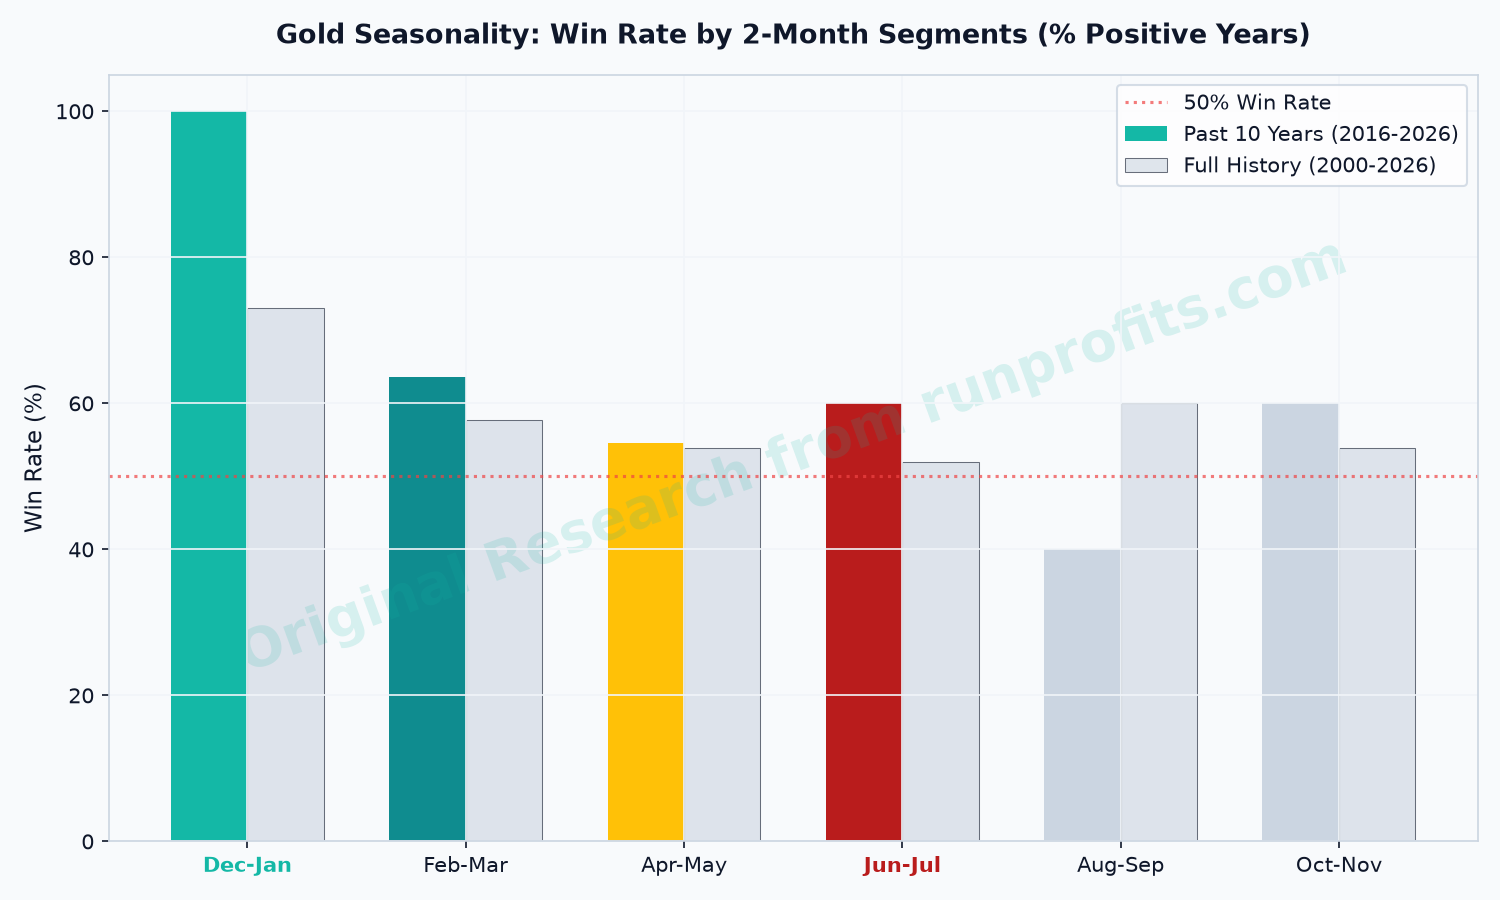
Custom 2-Month Segment Seasonality
To analyze the summer lull without splitting June and July across calendar blocks, we group the year into six continuous 2-month segments starting in December. This keeps the June-July block intact.
| Segment | Recent Price Range (Open – Close) | Avg Return (10Y) | Avg Return (26Y) | Median Return (10Y) | Win Rate (10Y) | Win Rate (26Y) |
|---|---|---|---|---|---|---|
| Dec-Jan Top Season | $4,218.50 – $4,713.90 (2025-26) | 5.74% | 4.46% | 5.17% | 100.0% | 73.1% |
| Feb-Mar | $4,807.70 – $4,647.60 (2026) | 2.89% | 1.40% | 2.05% | 63.6% | 57.7% |
| Apr-May | $4,668.40 – $4,560.50 (2026) | 2.08% | 1.49% | 0.99% | 54.5% | 53.8% |
| Jun-Jul Summer Lull | $3,296.90 – $3,293.20 (2025) | 2.28% | 0.46% | 0.23% | 60.0% | 52.0% |
| Aug-Sep | $3,286.20 – $3,840.80 (2025) | 0.50% | 2.86% | -2.64% | 40.0% | 60.0% |
| Oct-Nov | $3,863.50 – $4,218.30 (2025) | 1.20% | 1.52% | 0.92% | 60.0% | 53.8% |
Crucial Insight on Summer Lull: While the average return for the June-July segment appears positive over the past 10 years (+2.28%), it is heavily skewed by three outlier years: 2016 (+11.0% due to Brexit), 2019 (+9.2% Fed pivot), and 2020 (+13.0% COVID stimulus). In the other 7 years, gold was flat-to-negative. This is reflected in the low median return of 0.23% and the long-term 26-year average return of just 0.46% (the lowest of all segments).
Comparison with Standard Calendar Segments
If we split the year into standard calendar segments (Jan-Feb, Mar-Apr, etc.), the summer weakness is divided between May-Jun and Jul-Aug, diluting the structural seasonal lull.
| Segment | Recent Price Range (Open – Close) | Avg Return (10Y) | Avg Return (26Y) | Win Rate (10Y) | Win Rate (26Y) |
|---|---|---|---|---|---|
| Jan-Feb | $4,350.60 – $5,230.50 (2026) | 5.03% | 4.22% | 81.8% | 73.1% |
| Mar-Apr | $5,346.60 – $4,614.70 (2026) | 3.58% | 1.53% | 81.8% | 53.8% |
| May-Jun | $4,636.70 – $4,172.90 (2026) | -0.49% | -0.55% | 45.5% | 53.8% |
| Jul-Aug | $3,310.10 – $3,473.70 (2025) | 2.95% | 3.05% | 70.0% | 68.0% |
| Sep-Oct | $3,485.70 – $3,982.20 (2025) | 1.01% | 0.94% | 40.0% | 53.8% |
| Nov-Dec | $3,976.20 – $4,325.60 (2025) | 2.26% | 2.80% | 80.0% | 73.1% |
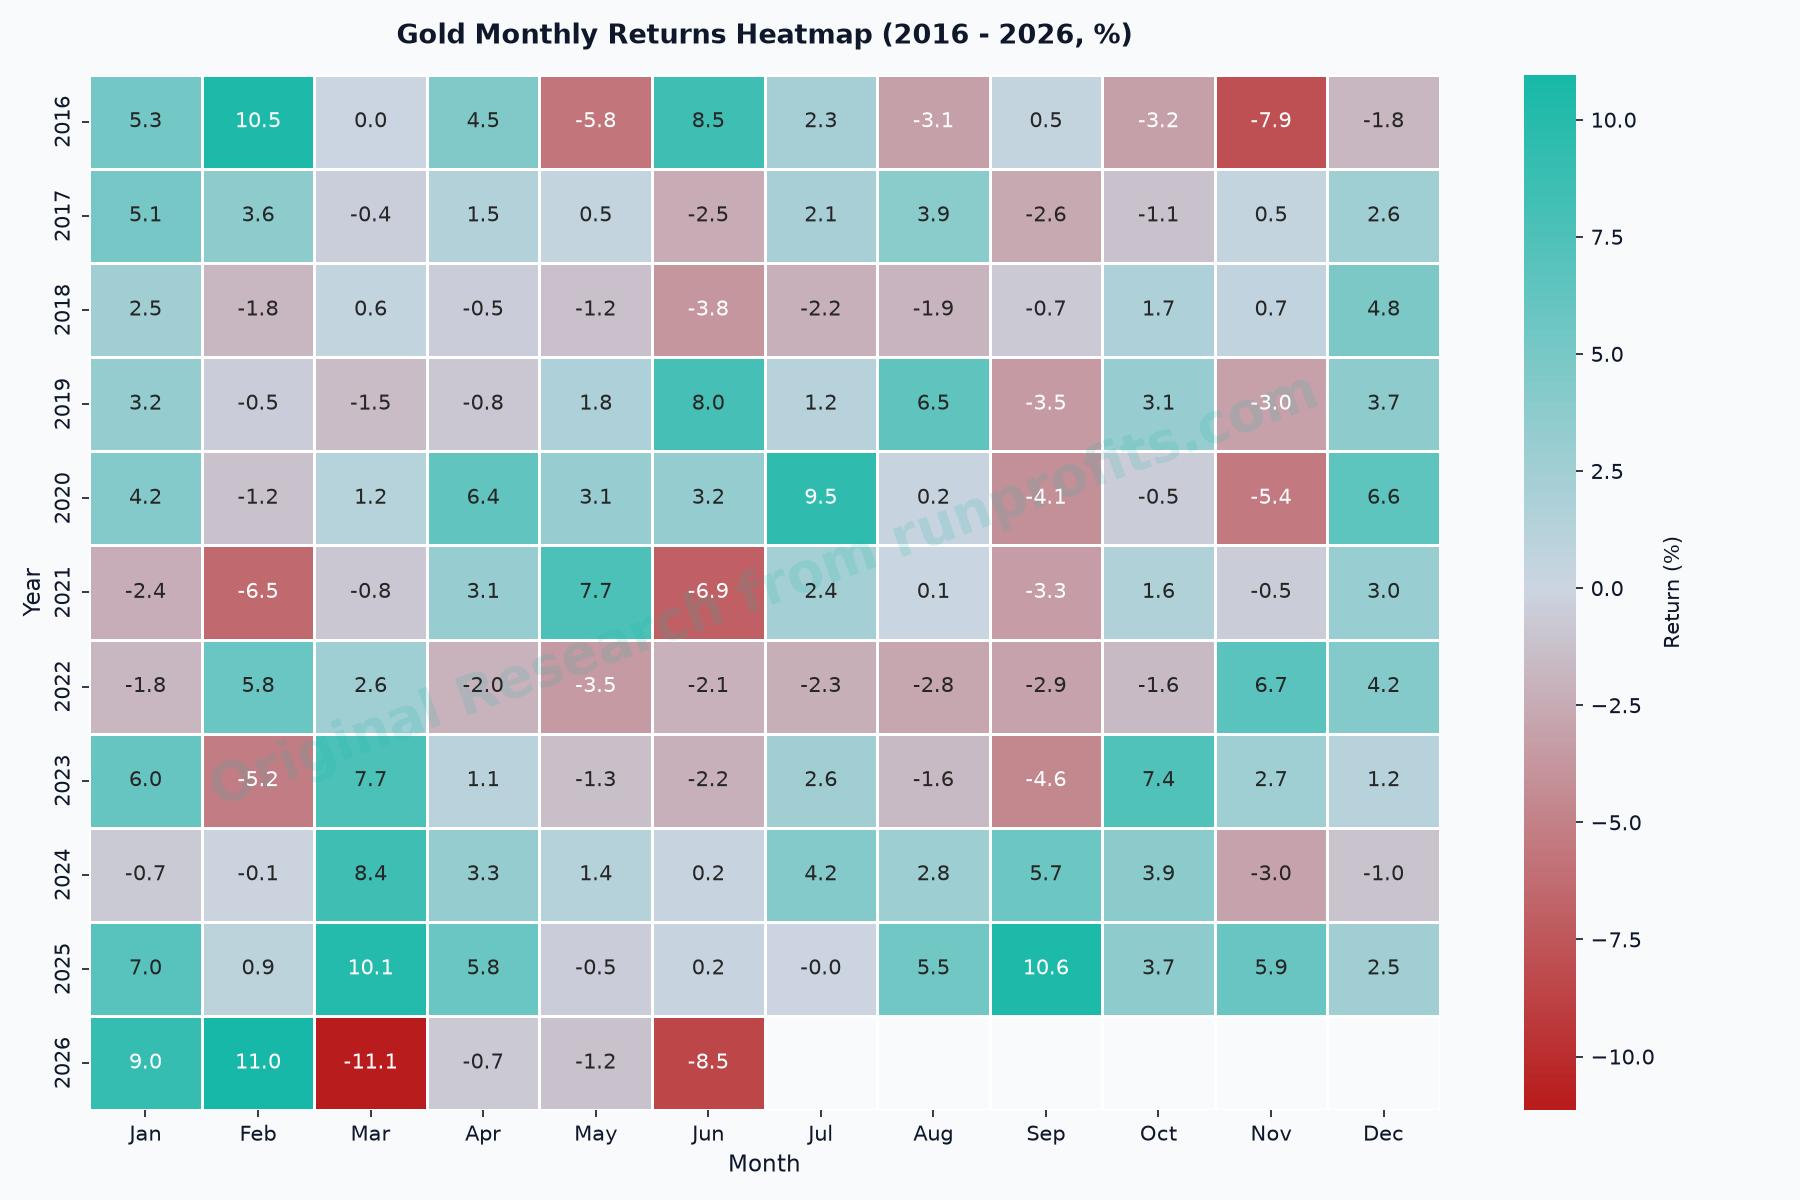
Month-by-Month Returns & Heatmap
The heatmap below illustrates the monthly return percentages for gold futures from 2016 through 2026. June has consistently shown a bearish bias (lowest average return of -0.77% over the full 26 years), while January (+3.00%) and August (+2.02%) show the strongest monthly return profiles.
Strategic Takeaways for Traders
- Avoid Spring Entries (May): Gold regularly enters its seasonal correction during this time. May has a 10-year average return of just +0.09% and a win rate of 45.5%.
- Accumulate during the June-July Dip: June is the weakest month of the year (averaging -0.77% over 26 years). Buying towards the end of June or during July allows traders to acquire gold at seasonally depressed prices.
- Ride the Turn-of-Year Rally: Gold has a 100% win rate in December-January over the past 10 years, averaging a return of +5.74%.