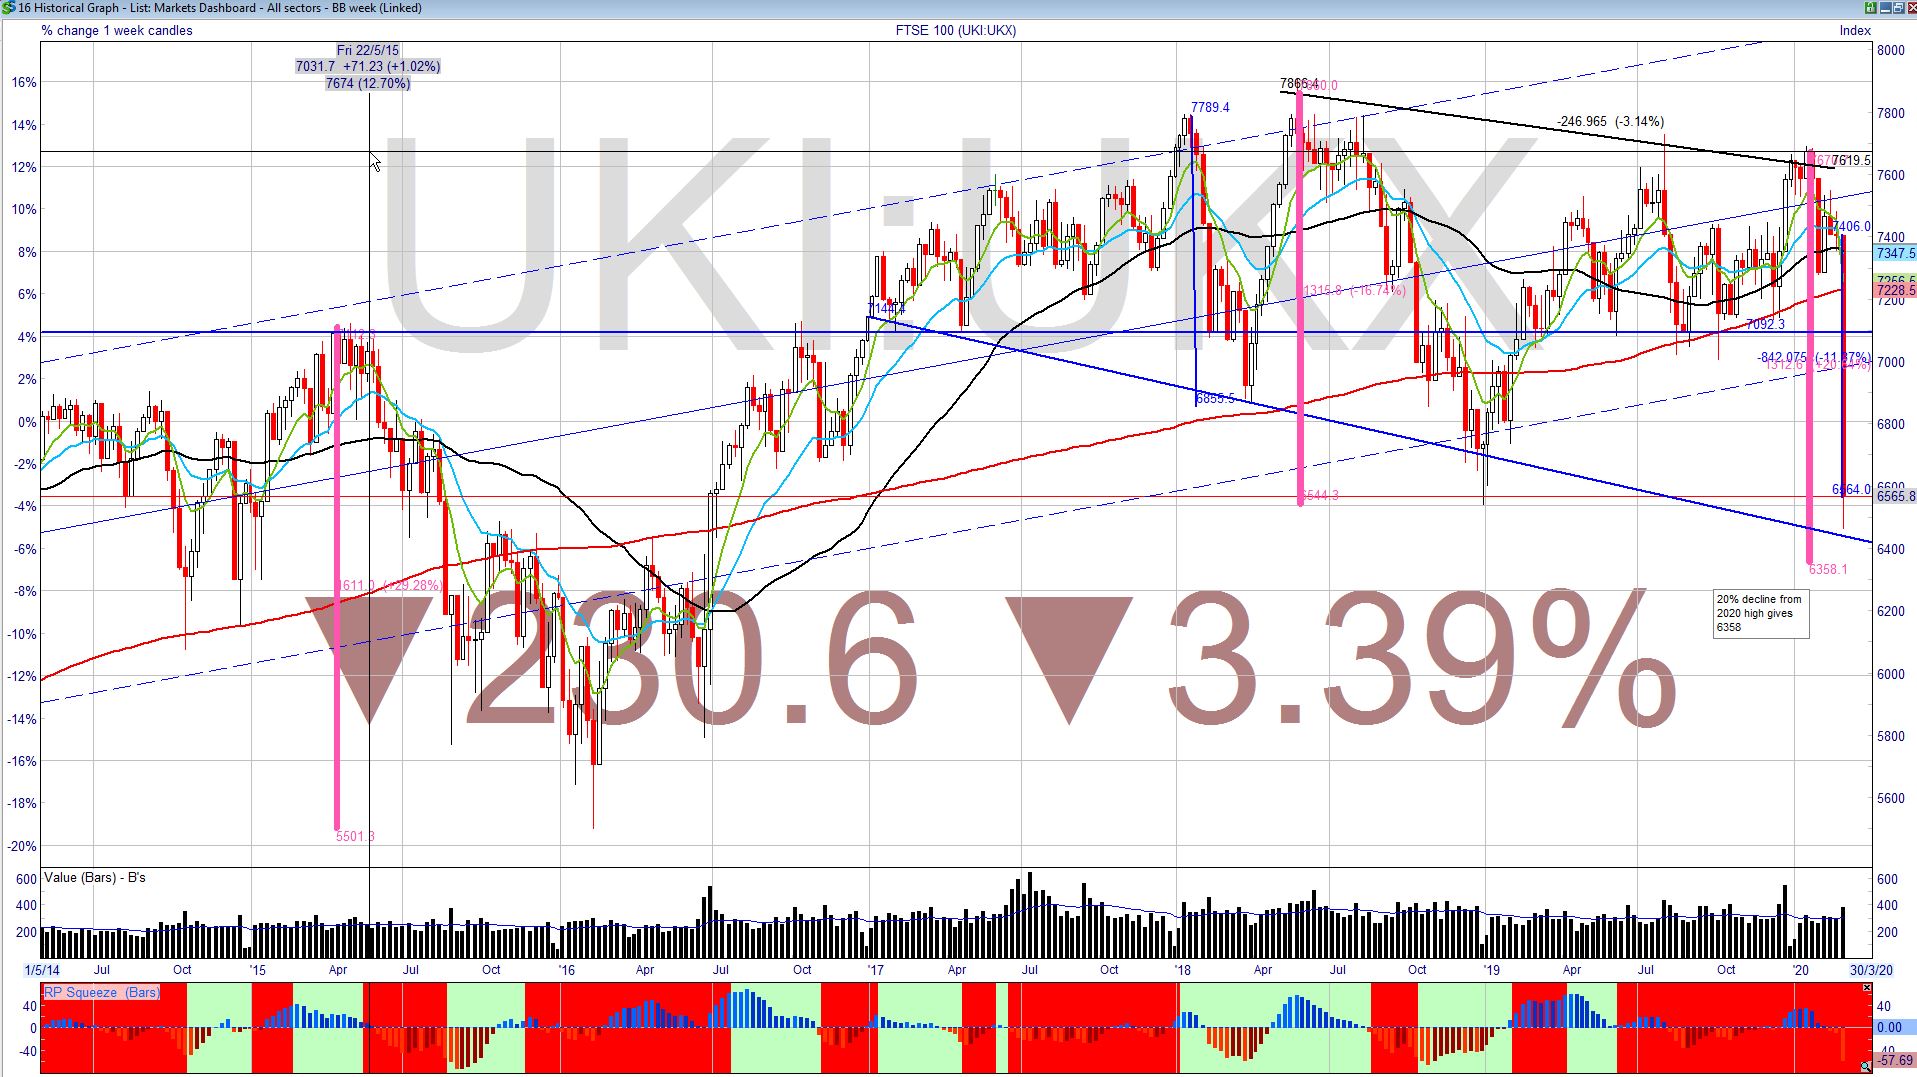
Weeks like this week are pretty extraordinary. As the pundits are putting it, one has to revisit the bad old days of 2008 and the GFC for similar tectonic movements. As we end February the weekly candle for this week shows -11.4% for the week. That is not without precedent as Oct 2008 had a weekly drop of over 21% just before the low of the financial crash. That was a 929 point drop from 4883 to 3929. As I like to say, you can't eat percentage and this week's drop in points or more poignantly ,GBP, was £842. In other words in absolute terms a value close to the biggest drop we have seen in modern history.
Just to be clear, over the past few years we have had corrections of a similar magnitude: between April 2015 and February 2016 the index dropped almost 29% from a high of 7119 to a low of 5707 : a decrease of £1,412. In 2018 we had a drop of almost 17% from a high of 7860 in June (the all-time-high) to a low of 6540 in December: a decrease of £1,320.
Clearly what is different this time is the speed and violence of this decay. What is unknown is whether it will continue and what many are wondering is has this old bull finally come to the end of its over extended run? We have not yet made a 20% correction which would take the index to around 6358 so a further decay to 6400 would not be uncalled for. Anything beyond that would take us more into bear territory and potentially a new phase in the market cycle. The likelihood of additional co-ordinated central bank life support may well act as an additional taurine boost to get this old bull moving again. Alternatively, the coronavirus's acceleration of a much threatened recession may auger the end of a long hibernation as we enter a bear market.
When you login first time using a Social Login button, we collect your account public profile information shared by Social Login provider, based on your privacy settings. We also get your email address to automatically create an account for you in our website. Once your account is created, you'll be logged-in to this account.
DisagreeAgree
Connect with
I allow to create an account
When you login first time using a Social Login button, we collect your account public profile information shared by Social Login provider, based on your privacy settings. We also get your email address to automatically create an account for you in our website. Once your account is created, you'll be logged-in to this account.

Weeks like this week are pretty extraordinary. As the pundits are putting it, one has to revisit the bad old days of 2008 and the GFC for similar tectonic movements. As we end February the weekly candle for this week shows -11.4% for the week. That is not without precedent as Oct 2008 had a weekly drop of over 21% just before the low of the financial crash. That was a 929 point drop from 4883 to 3929. As I like to say, you can't eat percentage and this week's drop in points or more poignantly ,GBP, was £842. In other words in absolute terms a value close to the biggest drop we have seen in modern history.
Just to be clear, over the past few years we have had corrections of a similar magnitude: between April 2015 and February 2016 the index dropped almost 29% from a high of 7119 to a low of 5707 : a decrease of £1,412. In 2018 we had a drop of almost 17% from a high of 7860 in June (the all-time-high) to a low of 6540 in December: a decrease of £1,320.
Clearly what is different this time is the speed and violence of this decay. What is unknown is whether it will continue and what many are wondering is has this old bull finally come to the end of its over extended run? We have not yet made a 20% correction which would take the index to around 6358 so a further decay to 6400 would not be uncalled for. Anything beyond that would take us more into bear territory and potentially a new phase in the market cycle. The likelihood of additional co-ordinated central bank life support may well act as an additional taurine boost to get this old bull moving again. Alternatively, the coronavirus's acceleration of a much threatened recession may auger the end of a long hibernation as we enter a bear market.