Contents: Click on Link to View
ToggleIt Began in 2018
If this past few weeks’ market performance has left you feeling bruised if not confused, you are not alone. While many will suggest that the summer is “normally” volatile, the summer of 2019 has been anything but normal at least in comparison to recent history even allowing for the 2016 market turbulence caused by the Brexit referendum. The gyrations in these past few weeks may well have their roots in 2018. The last quarter in 2018 did a lot of damage to the main UK markets with the FTSE 100 falling almost 10% while the 250 fell 22.5% and the AIM All-Share almost 25%. All three indices had made their all-time highs* earlier in 2018 so pull backs were to be expected. Healthy pullbacks are normally around 10%: pullbacks greater than 20% are considered bear corrections.
(* AIM All-Share ATH was in 2002 and was 2922 compared to current 859)

2019, New Year , New Sentiment
Almost from day 1, 2019 started with much better sentiment: all of Indices forged a comeback with the FTSE 250 making its 2019 high in April up over 10% followed by the AIM All-Share adding 13% by the start of May (the AIM 100 up 17%) and finally the FTSE 100 topping out on 29 July up over 14% . Volatility had been low, spookily low with the US VIX dropping to below 12 in July. A VIX around 20 used to be normal while a VIX over 30 was nothing too unusual post the GFC of 2008.
Storms on the Horizon
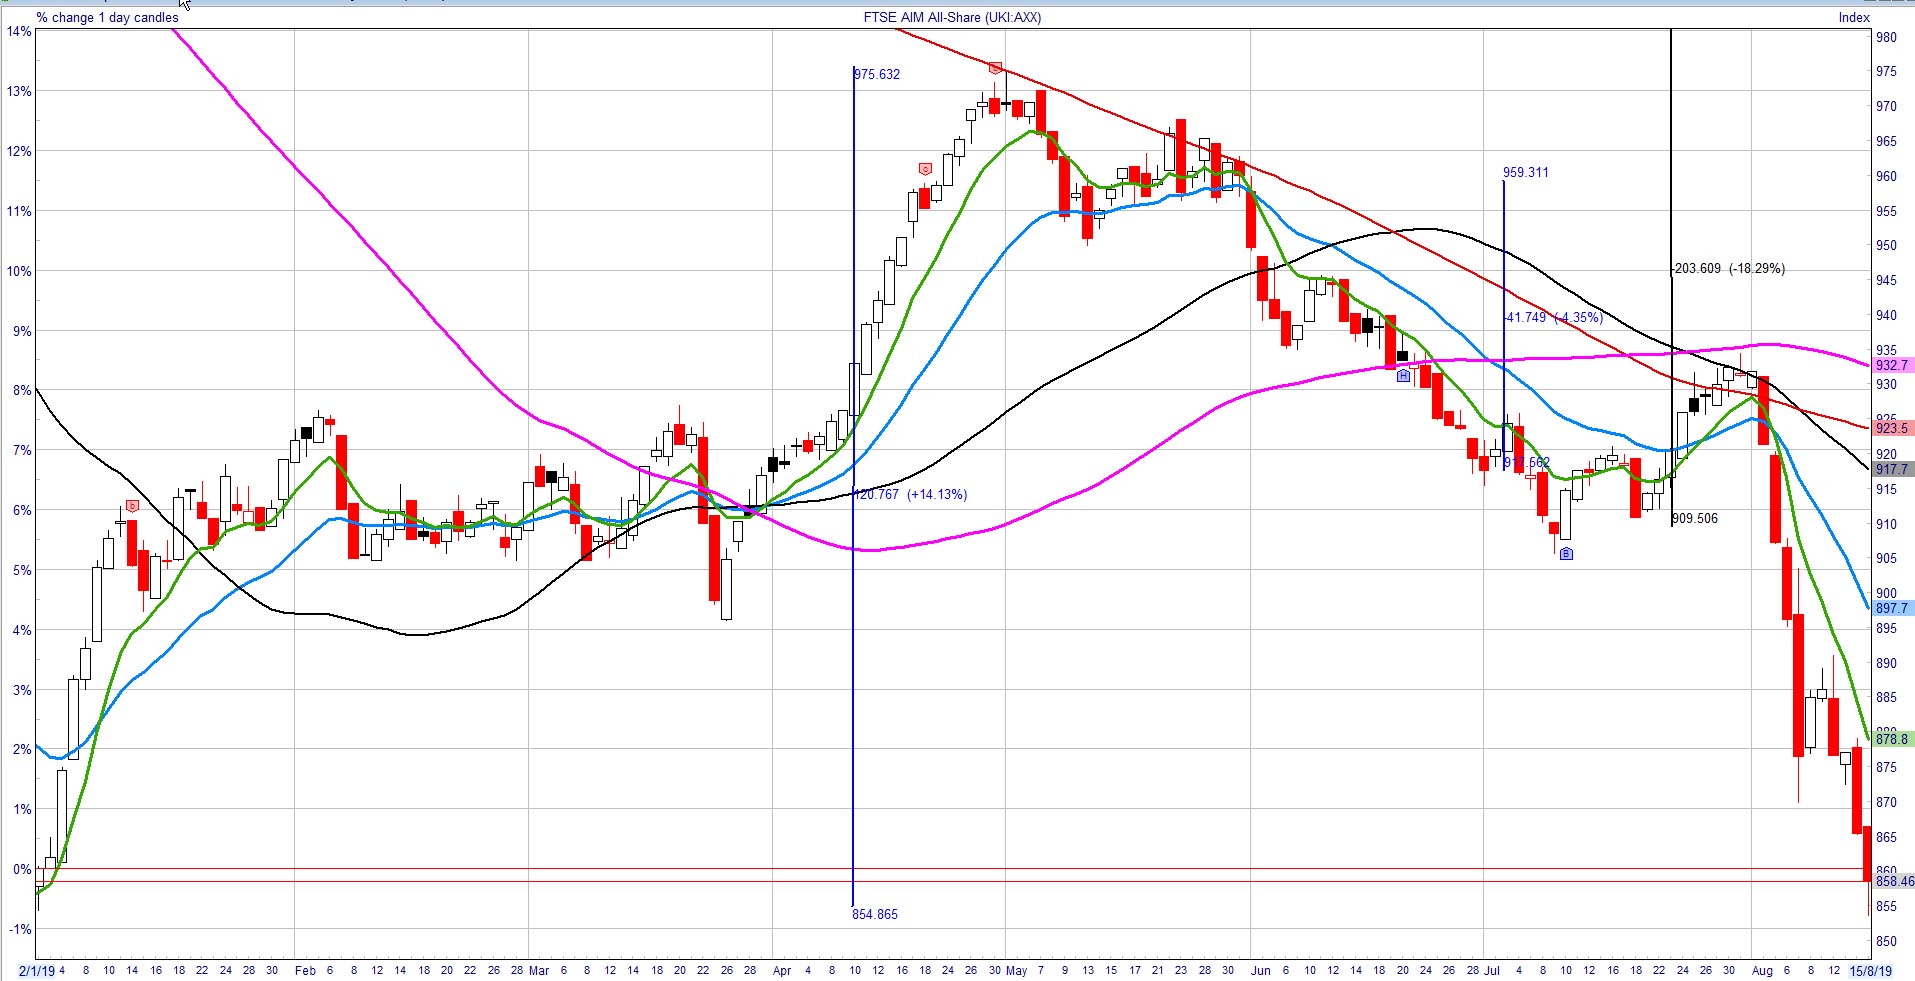
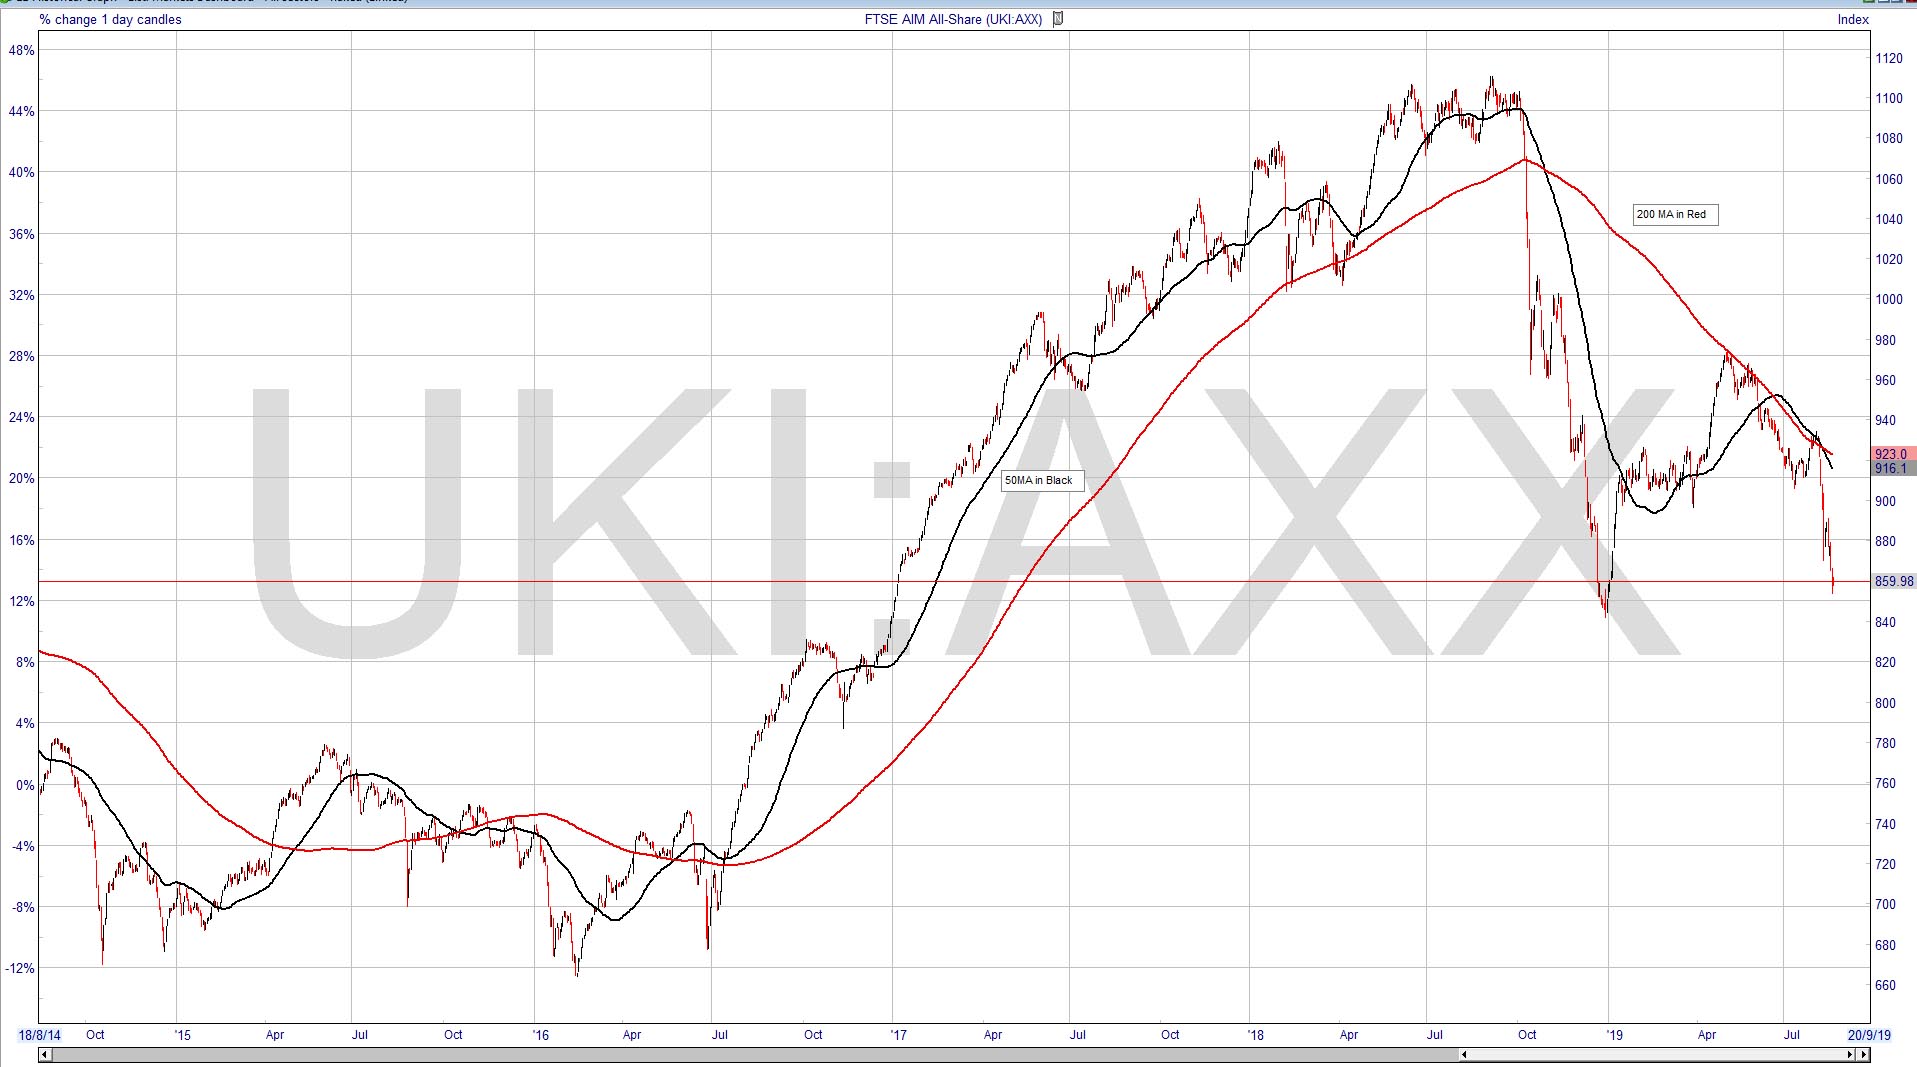
August came and with it a dramatic change in fortunes -in the past three weeks, the AIM All-Share has relinquished almost all of its gains and is 11% below its 2019 high all but revisiting the 2018 lows and stands 22.5% below its 2018 high. Ditto with the AIM 100 with a spectacular fall from grace by Burford with FEVR and PRSM both dropping by almost 50% from their 2018 highs. The AIM 100 is 14% below its 2019 high and almost 27% below its 2018 ATH. Given the technical definition of a bear market is a correction greater than 20% by which criteria, AIM 100 and All-Share are firmly in bear territory and behaving in very petulant ursine ways. A chart for the AIM All-Share shows that the index hasn’t broke above its 200MA for a sustained period since it lost it in Oct 2018 despite numerous attempts in May, June and July ’19 (from which it sold-off rapidly). Worth also noting that it had consistently stayed above the 200MA since 2016
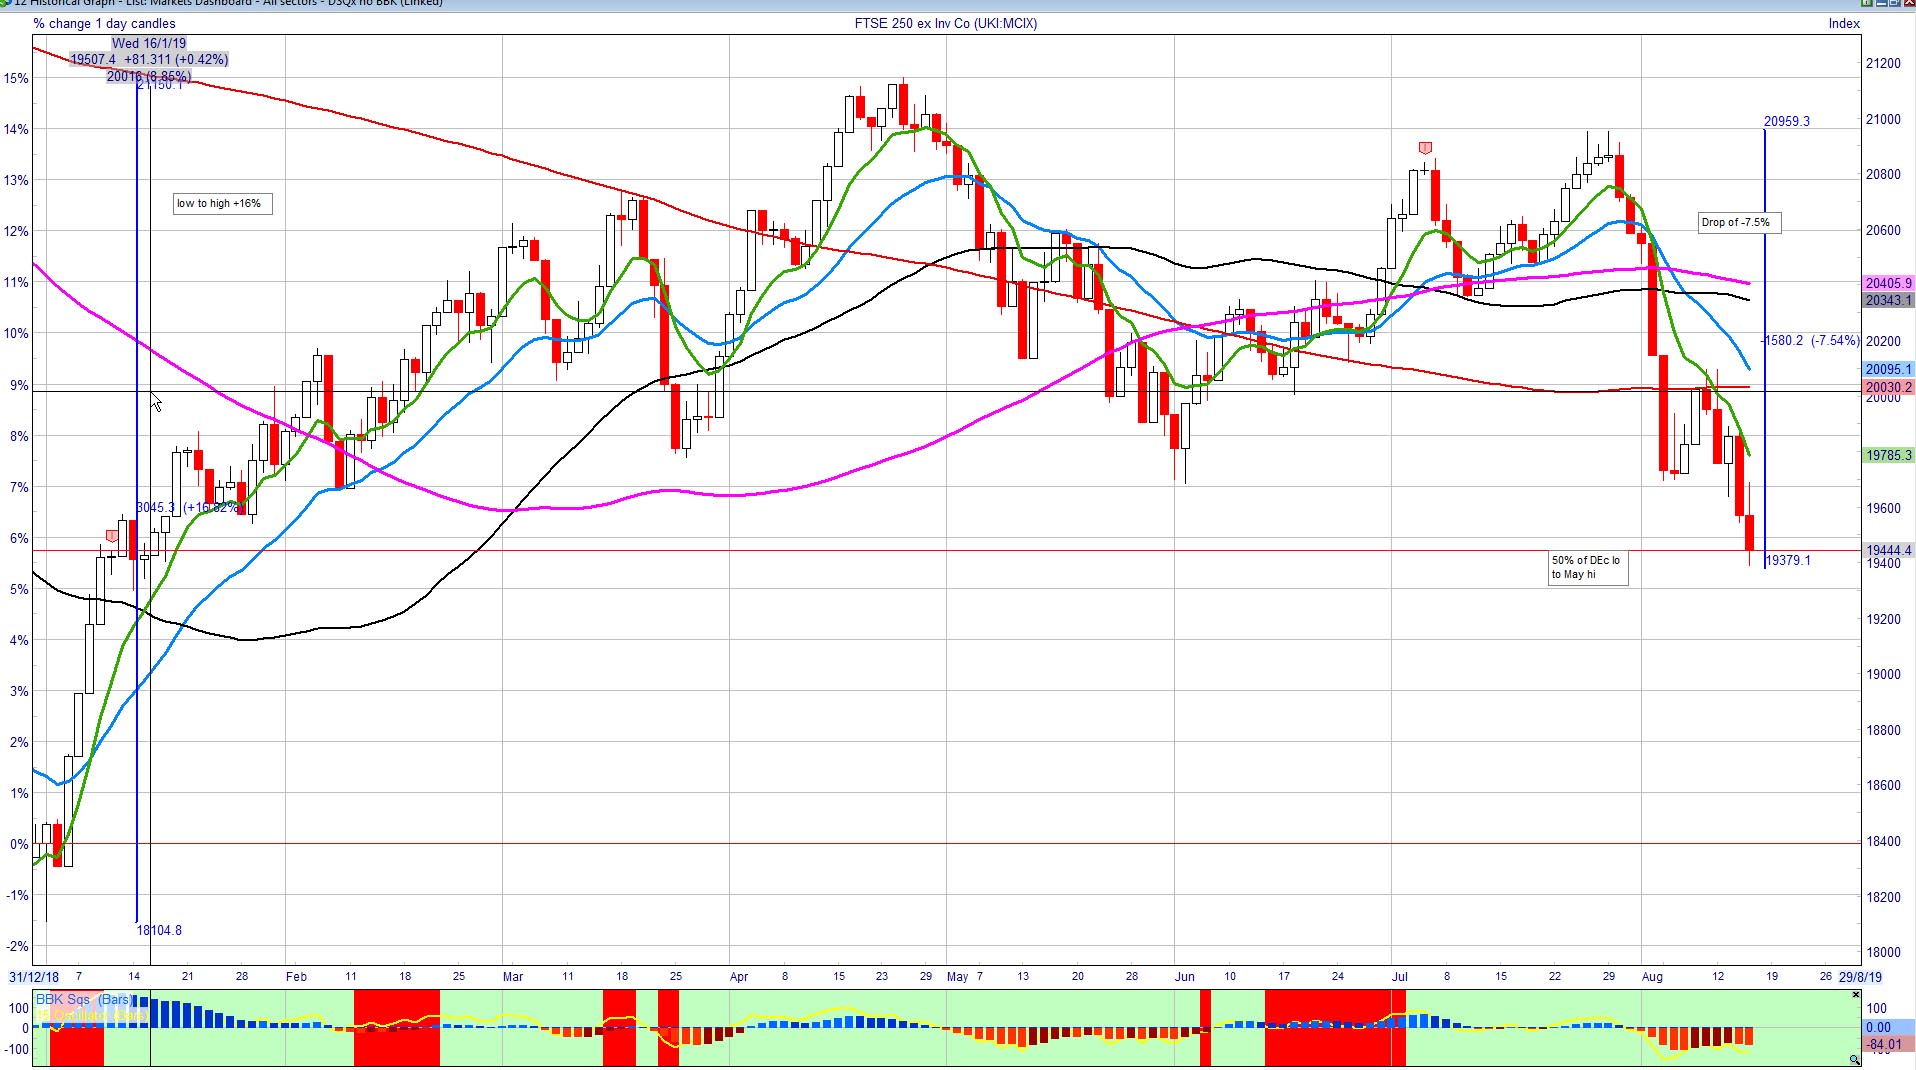
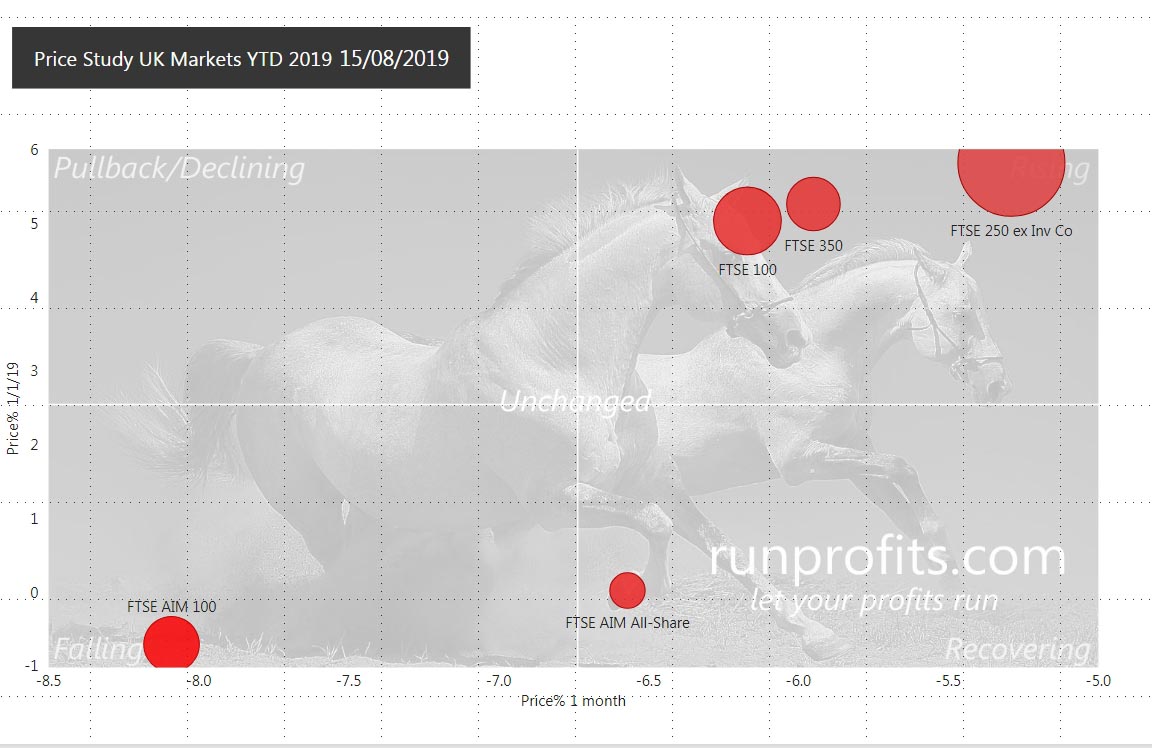
The FTSE 250 while bruised is better behaved down 8% from the 2019 highs but off 15.5% from the ATH. Not quite a bear but certainly no great bull either.
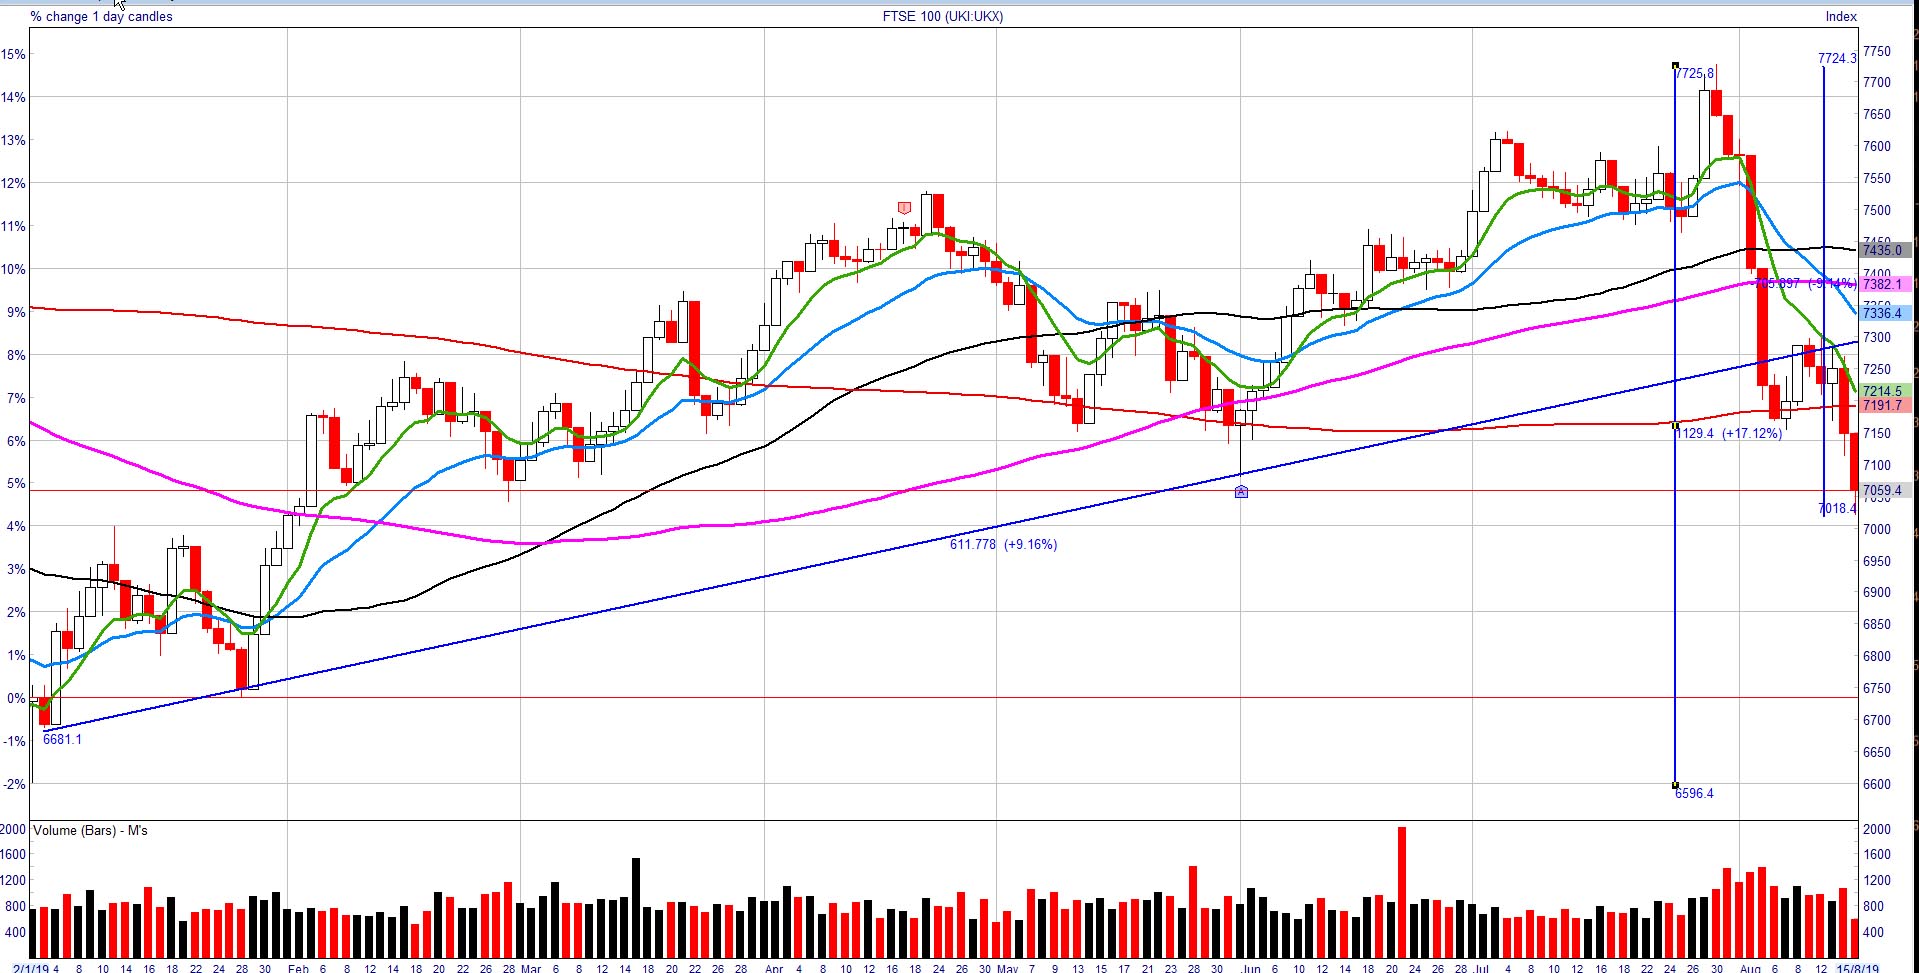
Finally, the FTSE 100 is the best of a fairly sorry lot down over 8% from the 2019 high and 10% from the all-time 2018 high. The index has been boosted by a very weak pound which enhances the non GBP earnings of its international constituents. When one considers that GBP on USD is down over 5% YTD then outperformance based simply on currency differential is to be expected
AIM Bears
In summary, none of the indices have retaken the 2018 highs and AIM is in bear territory. Its small wonder times have been tough. There’s a multitude of macro to provide the narrative for the summer of discontent: poor economic data signalling contraction in the UK and Germany, trade wars, currency wars with a devaluing Yuan, a 2s/10s inverted yield curve in the both the US and UK, Brexit, Hong Kong, North Korea, the Gulf of Oman. This wall of worry seems fortress like.
Underlying all of this there are a few irrefutable facts for now; interest rates are low and staying low (getting lower in the US?). Monetary accommodation hasn’t stopped and look set to restart in Europe. Inflation is nowhere to be seen. The US markets have remained bullish and have made new all-time highs in 2019 in the S&P, Dow Jones and Nasdaq. Only the small cap Russell has failed to make a new high and actually has a chart somewhat similar to our AIM All-Share.
The ongoing uncertainty is the trade war which is appears to be having profound and systemic effects beyond the intended objectives. Currencies and commodities have become the bellwethers for international détente with commodities appearing to take the brunt. An alternative narrative is that the slowing of global growth (or even recession?) is being reflected in the demand for cyclical commodities which always tend to overshoot with excess supply before scaling back in response to price and eventually undershooting demand to restart the cycle.
The plot below shows the changes in the major commodities YTD.
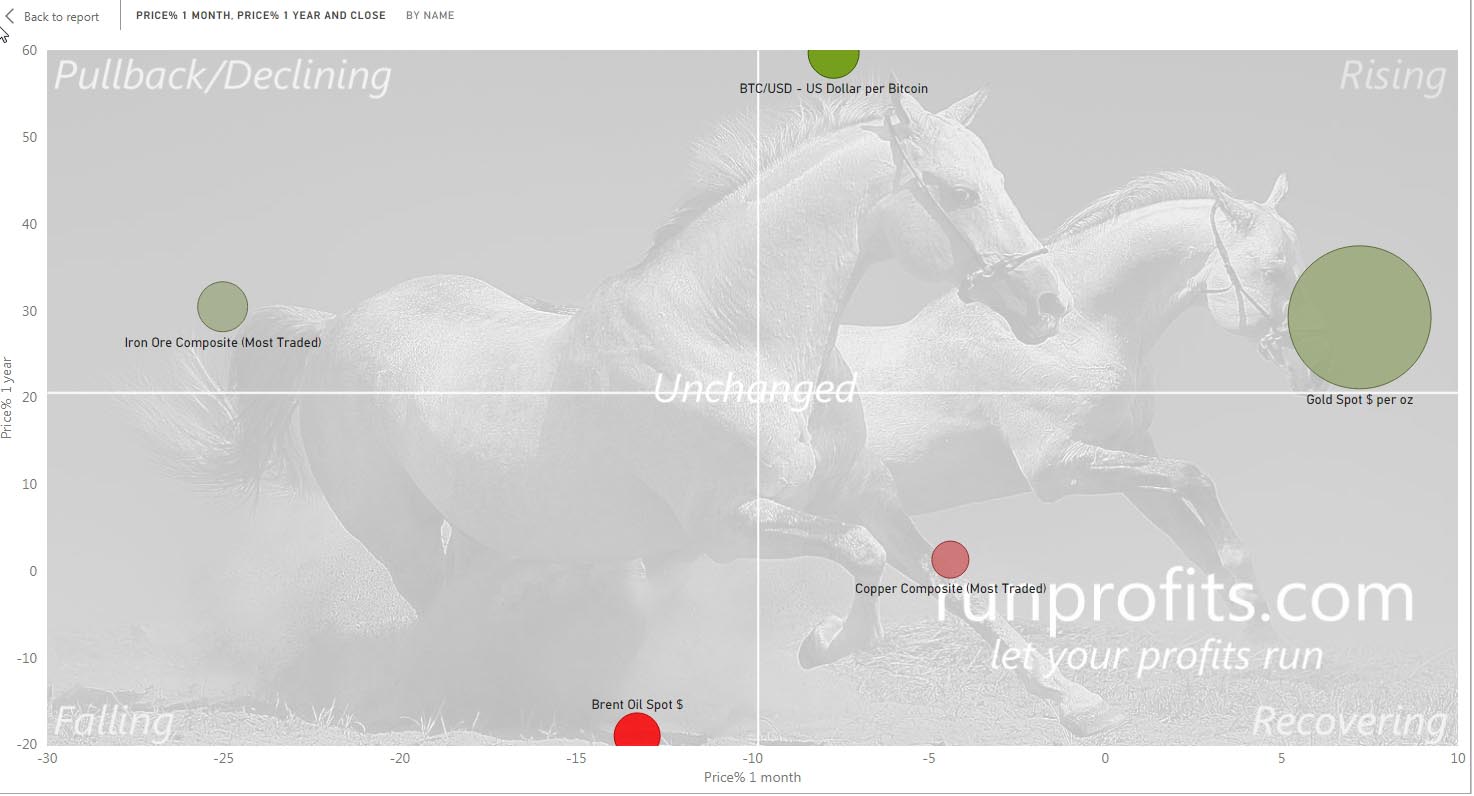
Commodities Doing the Damage
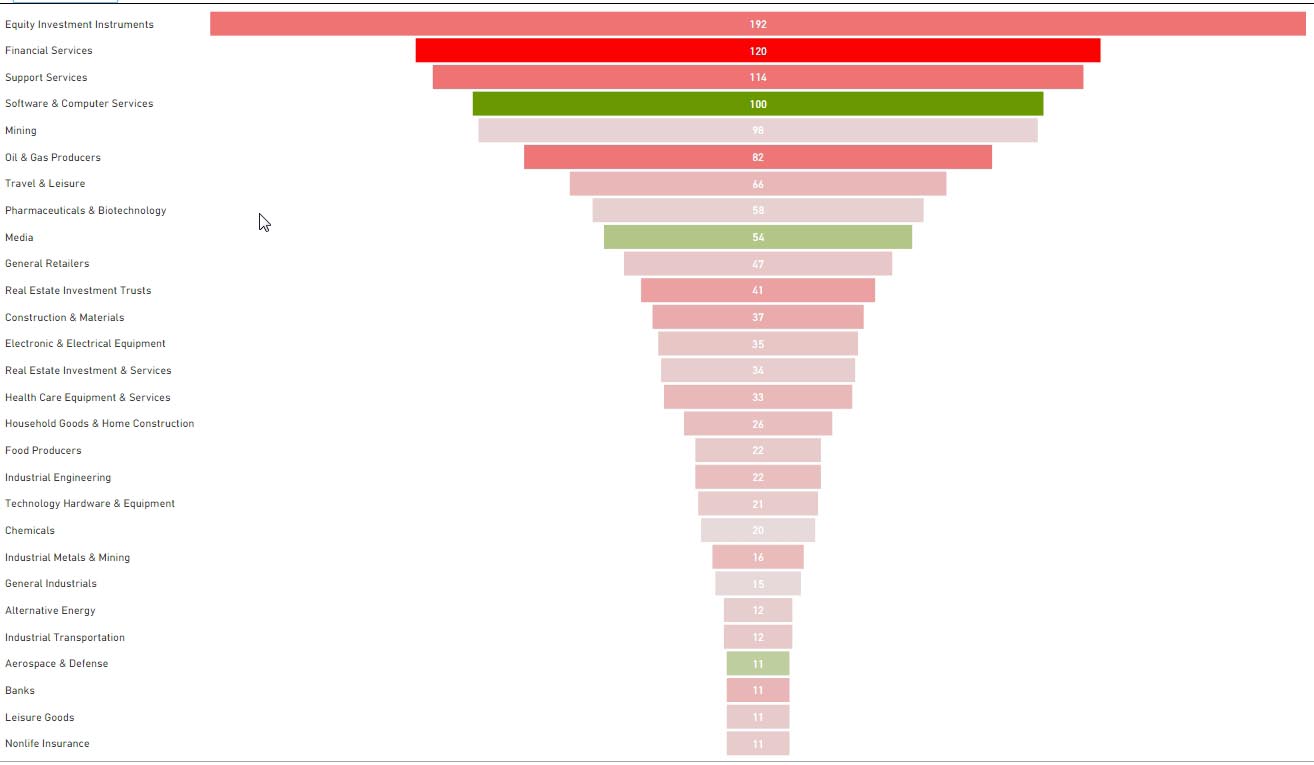
Figure 4 shows that oil is having a torrid year down 20% YTD and down almost 15% of that is just a month: this is having a big knock-on effect on the UK indices: of the 1408 equities listed on the UK markets 82 are oiler making up the biggest sector by cap accounting for 15% of the total by value of the UK equity market. Figure 5 shows how all 1408 shares breakdown into sectors by market cap. Mining is the fourth largest sector accounting for 9.5% of the total equity market. Iron ore has dropped 25% in value in the past month while copper is down 5%.
Big drops in commodity prices result in major damage to the UK indices which in turn affects sentiment and stimulates more selling
What is Losing the Most?
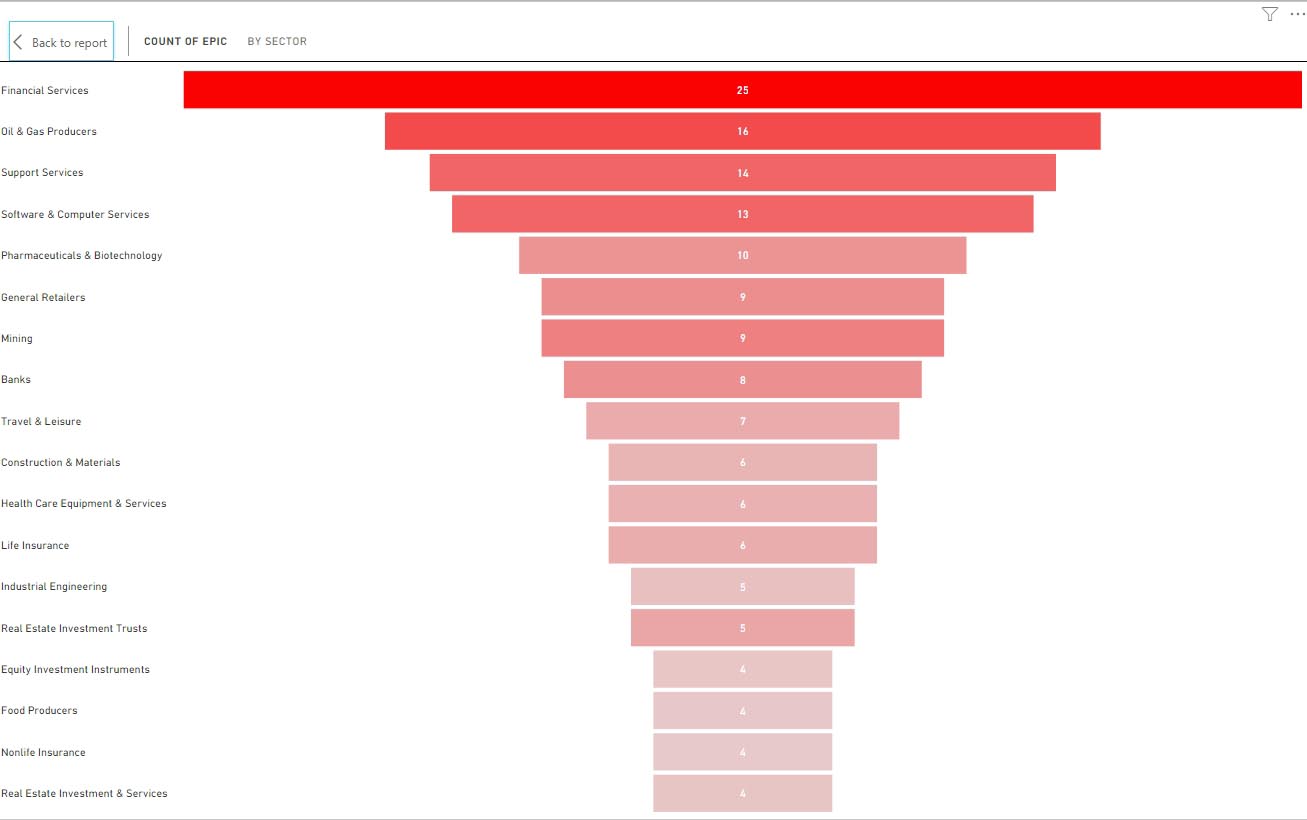
Figure 6 shows a plot of shares that have fallen more than 10% by sector over the past month: Oil and Gas, Financial Services and Mining are the worst performing sectors reflecting the weakness in commodity prices and the fears of global slowdown. One can view these as either a clear warning to avoid these sectors or opportunities to look for bargains. Given the relatively late stage in this economic cycle. reducing weight in these sectors is going with the flow and the underlying commodity prices.
What is Gaining the Most?
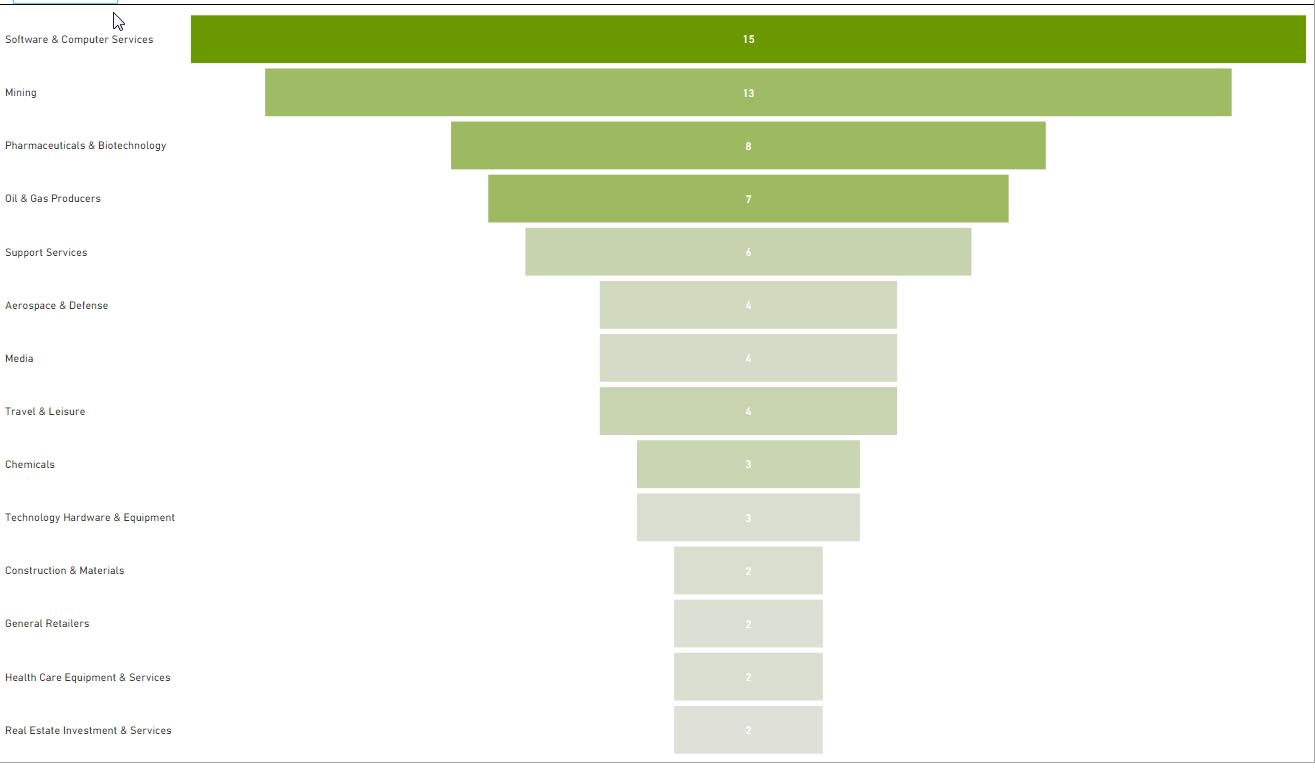
Figure 7 shows a plot of shares by sector which have gained 10% in the past month. Technology is still working all of the 13 mining stocks in the green are gold miners tracking the price of gold. Healthcare, Beverages and A&D have all outperformed
There is also a notable shift away from the smaller caps to bigger caps and value plays
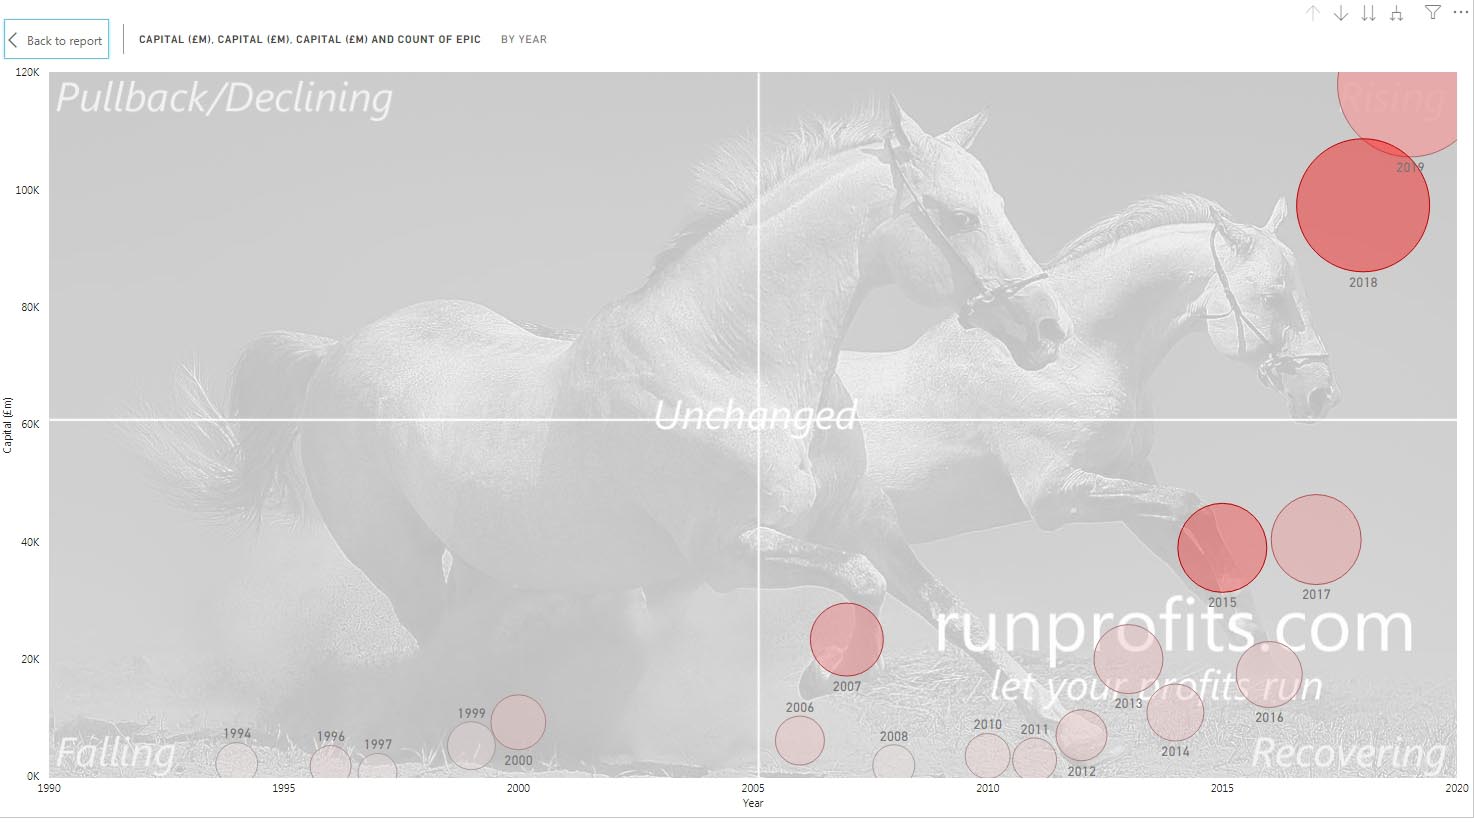
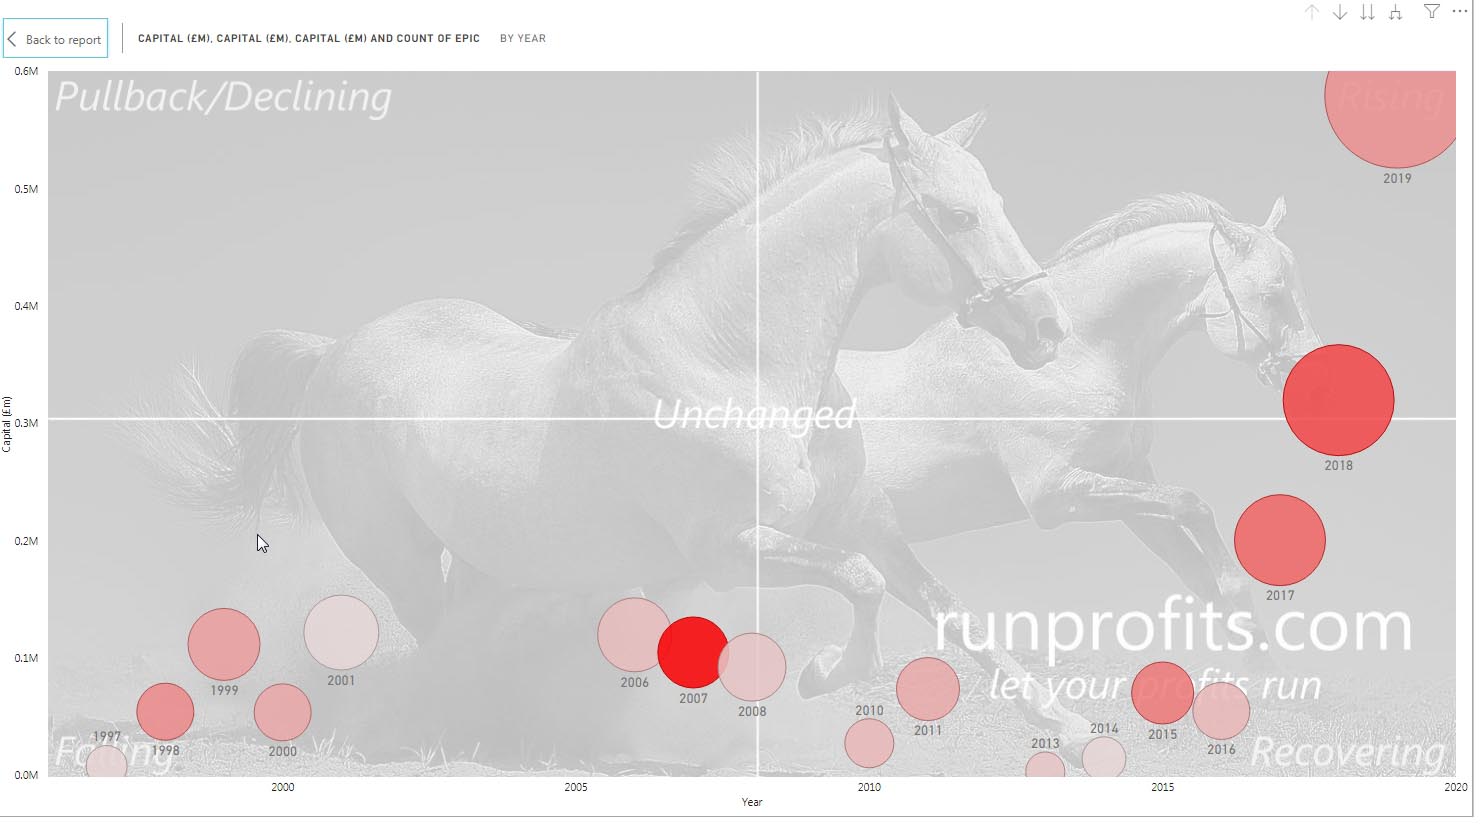
A plot of all-time-highs against time shows that the AIM All-Share peaked in 2018 while the FTSE 250 and FTSE 100 made the most all-time highs in 2019
in 2017 75 of the AIM All-Share made ATHS compared to 130 in 2018 and 59 in 2019
The FTSE 250 had 23 ATHs in 2017, 68 in 2018 and 66 so far in 2019
By contrast, in the FTSE 100 17 made ATHs in 2017, 18 in 2018 and 26 so far in 2019: many of the current large caps making ATHS are in defensive sectors like Pharm, Healthcare, Beverages, Personal Goods
Conclusions
Since the sell-off of 2018, AIM has not staged a sustainable recovery and remains in a bear market
Based on the number of all-time-highs and the size of the companies making ATHs, there has beena trend towards bigger, safer companies in 2019 which reflects the global macro uncertainty and the UK specific issues with the economic effects of Brexit
The outperforming sectors in 2019 have been defensives with Pharmaceuticals, Healthcare, Beverages and Personal Goods providing the best returns so far. The resources sectors are bearish and declining in line with falling commodities prices and a stronger dollar