Contents: Click on Link to View
ToggleDaily RPG Reports: Hit + to Expand Tab and Access Report: (Latest Update Open by Default)
Publication Schedule
below times are indicative and can be subject to data availability and prone to occasional technical issues. The purpose of this is to find trading opportunities and not to provide a comprehensive or accurate news service. The London Stock Exchange publishes regulatory news here . This should be the ultimate source to verify any RNS type data
- 1. Pre Market RNS 07:15: identify potential catalysts in RNS to trading opportunities based on chart set-ups: scope potential positions for market open
- 2. AM Liquidity 08:15-09:00 : market responses and price reaction to overnight/RNS catalysts : identify good entry points for trades (breakouts/downs, gaps) in early liquidity
- 3. Pre Close 15:00-15:30 captures the impact of US participation/enhanced liquidity and identifies potential setups before market close
Click on a tab below to open the RNS Report
Click on EPIC to open the chart Click on Headline to Open RNS Click on Time Stamp to see all recent News Help and Navigation
Pre Market FTSE 100 holds 7200: Gold Holds Key Level: DXY New Highs
FTSE Futures unch on cash close as the index struggles to hold the 7200 level (chart) : this support looks key, loss of which may give way to a measured moved to 6800 and below
US closed mixed and off lows and while S&P and NASDAQ made new '22 lows intraday - recovered into close with the tech index +0.2% on the day as value tech names like MSFT, AAPL and GOOG rallied (see map)
Sentiment see VIX at 33 relatively unch
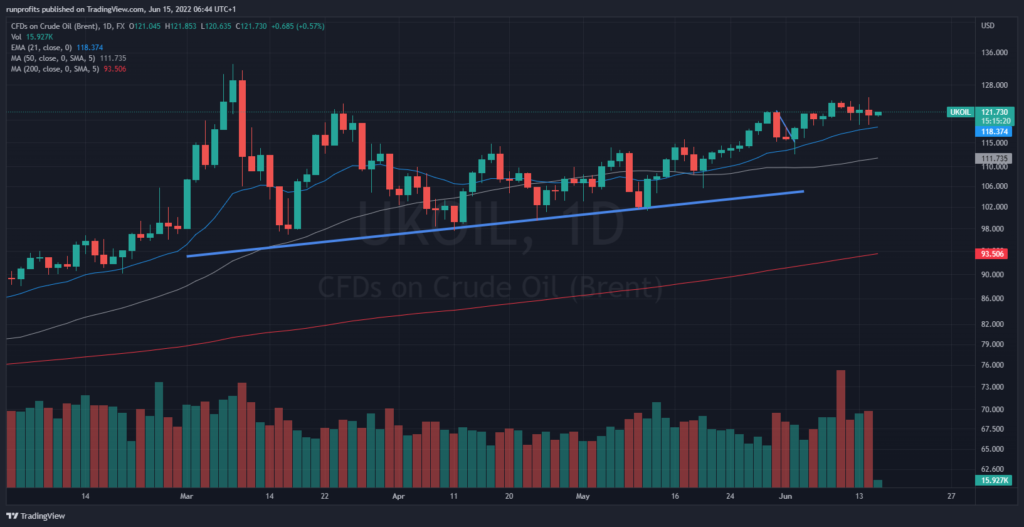
OIl slight pullback to 8EMA remains in strong uptrend with some loss of momentum
DXY drove higher on interest rate expectations and sits at new multi year highs
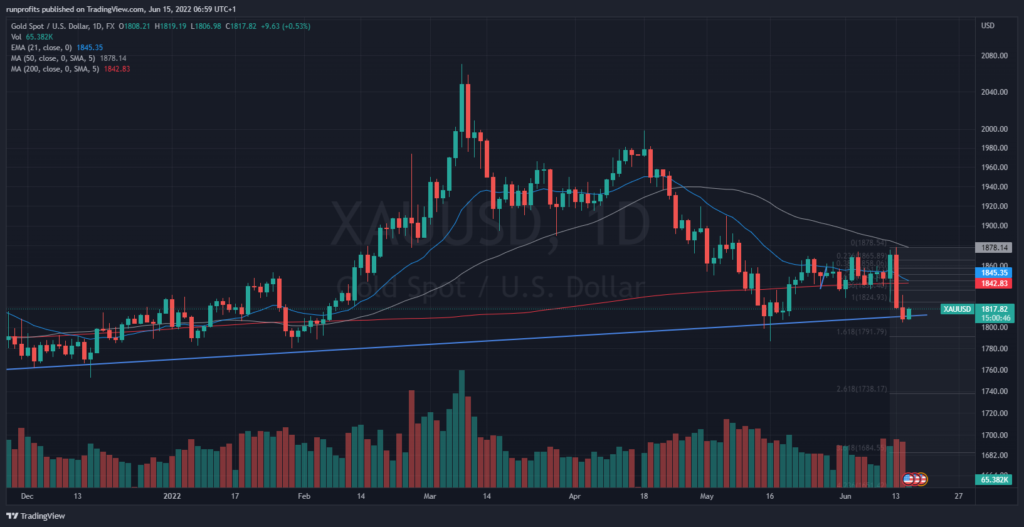
Gold holds trendline after steep pullback has recovered overnight and sits at $1818 (chart)
Econ Calendar focus today dominated on Fed rate decision with 0.75 bps widely touted
Charts - click to open to full size
Market Dashboard
FTSE 100 - 7200 Key Support
US Stockmap Close
Gold Chart
DXY Chart
Brent Oil Chart
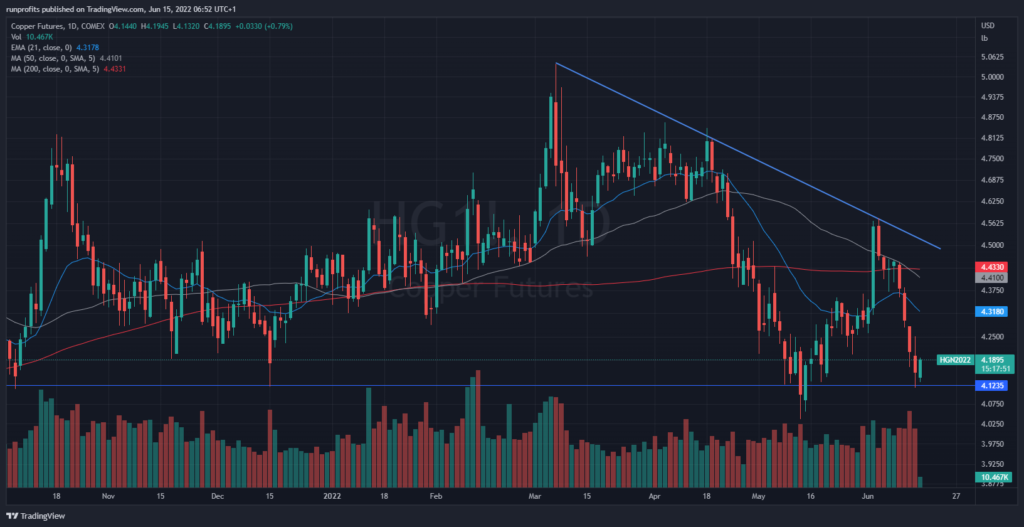
Copper Chart


