[stock_market_widget type="comparison" template="basic" color="teal" chart_range="1d" chart_interval="5m" assets="DPEU.L,CINE.L,QUIZ.L,SHOE.L,WRKS.L,COST.L,CPT.L,BCN.L" fields="name,change_abs,change_pct,volume,market_cap,chart,open,high,low,last_update" api="yf" style=" width: 1200px; margin-left: auto; margin-right: auto; background-color: white;"]

Price quotes delayed by 15 minutes or more, see update timestamp for details. Refresh page to force update

Read Friday’s RPG and View the Data Reports

PM Update : PMIs and Vaccine News Dent Gold

This morning I highlighted how gold was nearing the end of its consolidation phase as the range became tighter and volatility contracted: these periods of quiet are the build-up before the release of energy and a sudden move. Gold specialises in head fakes when it comes to making major moves where the  spot price will move violently in the opposite direction of the intended move to take out a lot of the waiting liquidity provided by stops. Once these have been removed, there sometimes follows another whipsaw manoeuvre in the opposite direction to mix things up even more. This can take out both short term longs and shorts who have stops within  close range of the recent price. There then follows the actual move which gathers force over the following days. While this increase in vol can make profitable scalping and intraday trades, the better money is normally made by waiting for the real trend to play out.

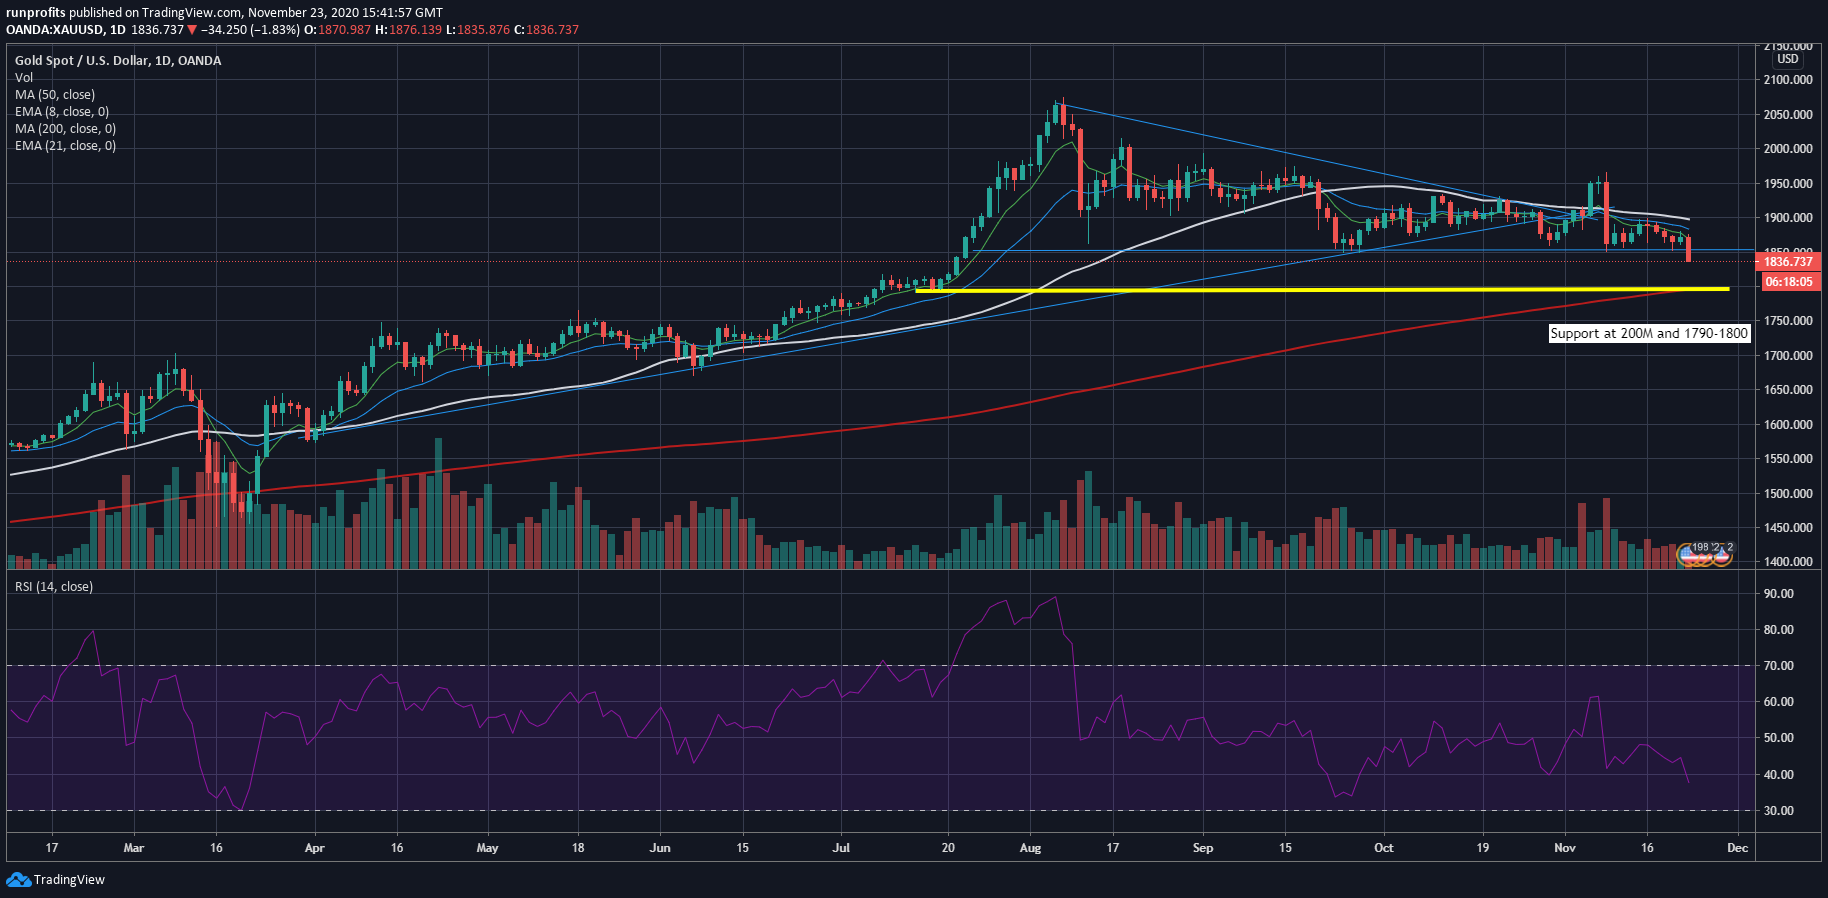
This morning saw gold drop over 1.7% to the $1830 level. This does look more of a breakdown that a shake-out adding to the  neutral to short term bearish view of the metal until price says otherwise. There's a good chance of a short term bounce intraday before more selling and a move to lower-lows

The AZN/Oxford good news on vaccines combines with some stronger than expected PMI prints from  the UK, Europe and the US boosted risk sentiment and may have prompted some funds to leave the gold worry trade.  While all the indices have taken some cheer from this morning's' news, the reactions suggest this was largely in the price  and if anything it is a sell the news type of reaction.

The loss of support around the 1850 level suggest that the next stop may well be a check of the 200MA around 1800 where there is confluence with good support .  See chart  below. A rally and close above the 1860 level would challenge this

Gold has show continued weakness even as the dollar has been weak which suggest that demand for the metal has been muted of late as betters returns are available in riskier assets owing to improved sentiment.


Gold Daily Chart with Support at $1800

Click to enlarge

Pre Market 07:15 AZN Vaccine : GBP strong, Oil above $45: Copper breakout

  • FTSE 100 futures show a positive start to the trading week + 30 points  at 6380: likely to make a renewed assault at the 6400 level on UK unlocking news and AZN/Oxford announce vaccine efficacy
  • Oil bullish at $45
  • Copper breakout ot new multi year highs
  • US indices consolidating and showing some weakness
  • Gold consolidating at 1874 and likely to make a move this week
  • VIX at 23.7, F&G 62

Last week saw the FTSE 100 relatively unchanged on the week as GPB strengthened while the FTSE 250 advanced almost 2% and the AIM All-Share 3.6% on the week

All of the indices are in strongly bullish mode with the vaccine boost and seasonal cheer dominating sentiment

VIX is showing some signs of uptick at 23.7 but muted by recent standards while the Fear & Greed index sits around 62.

Typically trading into the Thanksgiving holiday in the US can be quiet and often bullish reflecting the relaxed holiday spirit, 2020 has been anything but typical thus far so US trading will be interesting and telling to watch.

As the UK indices are stretched and overdue a decent pullback, the US may tip the balance in either direction .

Oil is bullish and above $45 which should help oilers and boost the FTSE 100 if RDSB and BP respond

Gold sits in a consolidating pattern but looks set to resolve with an obvious bias to resuming its move north; this is often signalled by a stop-run south before reversing and then moving sharply higher: we watch for a signal to take a position

Copper futures have made a move to the $3.31 level and is at highs not seen since 2017 :while this is often taken as bullish on industrial demand and economic activity, supply constraints owing to the pandemic are also likely affecting prices so some caution should be taken in interpretation.

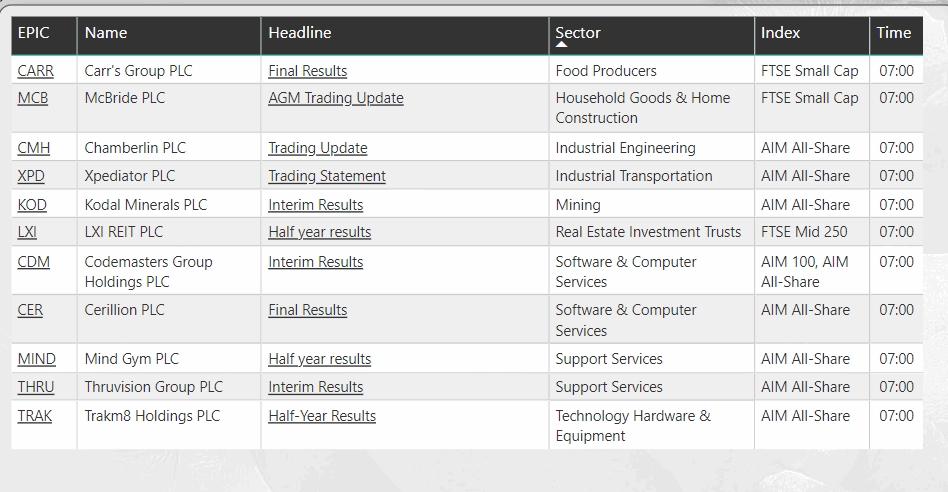
11 UK Companies Reported by 07:35


Open a chart  using the opposite Search Box (add .L to the EPIC to specify UK):  covers every asset class and most markets incl. US : redirect  basic charting pages.

Search by Company/EPIC Below
[stock_market_widget type="search" template="redirect" color="#23282c" url="/stocks/{symbol_lc}" target="_blank" api="yf"]

> Post a Comment or Ask a Question <<

5 1 vote
Article Rating
Subscribe
Notify of
guest
0 Comments
Oldest
Newest Most Voted
Inline Feedbacks
View all comments