Contents: Click on Link to View
ToggleDaily RPG Reports: Hit + to Expand Tab and Access Report: (Latest Update Open by Default)
Publication Schedule
below times are indicative and can be subject to data availability and prone to occasional technical issues. The purpose of this is to find trading opportunities and not to provide a comprehensive or accurate news service. The London Stock Exchange publishes regulatory news here . This should be the ultimate source to verify any RNS type data
- 1. Pre Market RNS 07:15: identify potential catalysts in RNS to trading opportunities based on chart set-ups: scope potential positions for market open
- 2. AM Liquidity 08:15-09:00 : market responses and price reaction to overnight/RNS catalysts : identify good entry points for trades (breakouts/downs, gaps) in early liquidity
- 3. Pre Close 15:00-15:30 captures the impact of US participation/enhanced liquidity and identifies potential setups before market close
Click on a tab below to open the RNS Report
Click on EPIC to open the chart Click on Headline to Open RNS Click on Time Stamp to see all recent News Help and Navigation
Pre Market Sentiment and Charts Influencing UK Markets 06:30 (3 mins read)
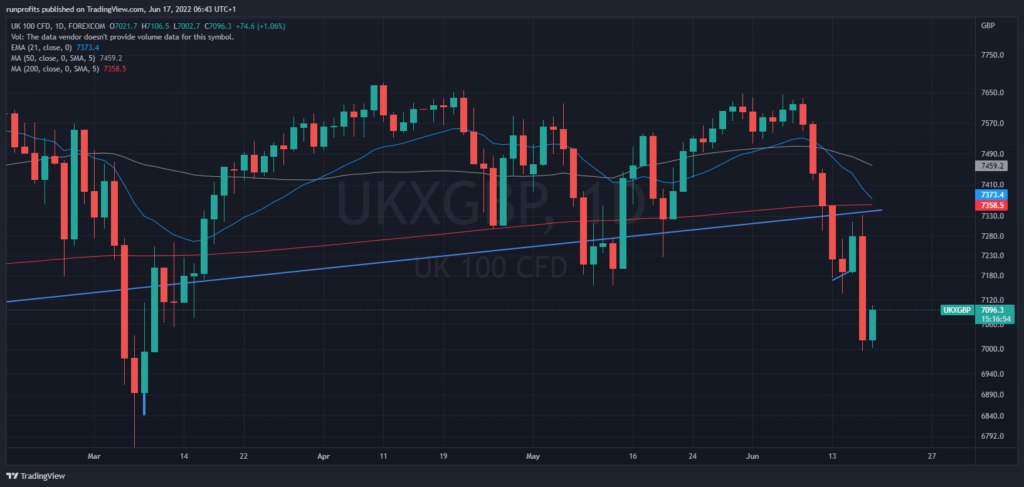
FTSE Futures dipped to 7000 overnight setting up a tradeable long and has rallied back to 7100 (+55 cash close) after a day of hectic price action and collapses in correlations:- often the mark of an intermediate low and capitulation. UK saw some sacrificial slaughterings with retail taking an extreme pounding on trading results and BoE suggestions of inflation at 11%+. ASOS, Halfords down over 30% in one day - proper hair on fire price action that should see a dead cat bounce in these names over the next few sessions
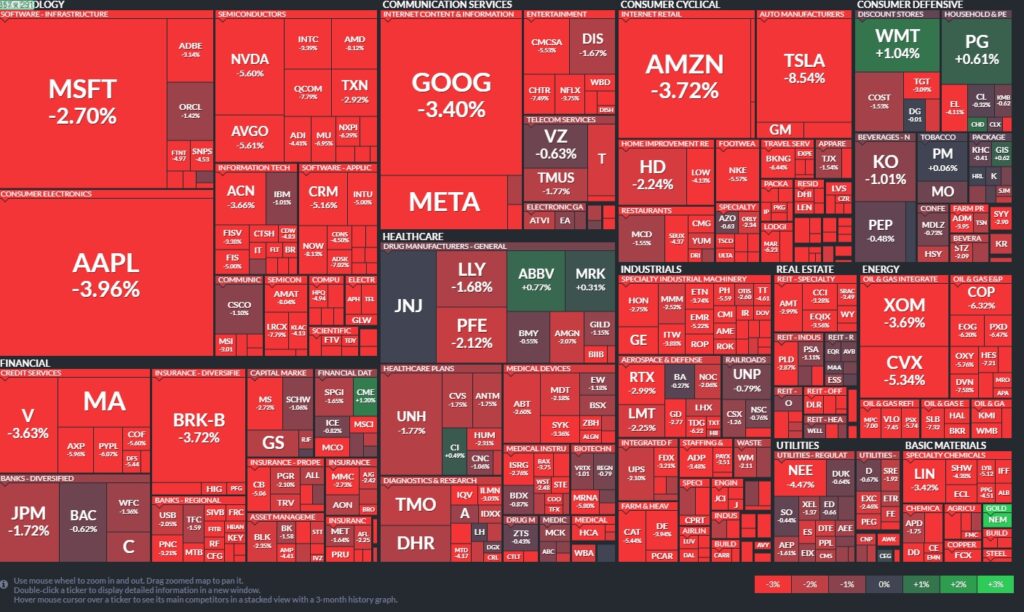
The US session was ugly in the extreme with the DOW dipping below 30000, NASDAQ got firebombed - 4% with even quality tech like MSFT, GOOG and AAPL pummelled. Energy also taken to the woodshed
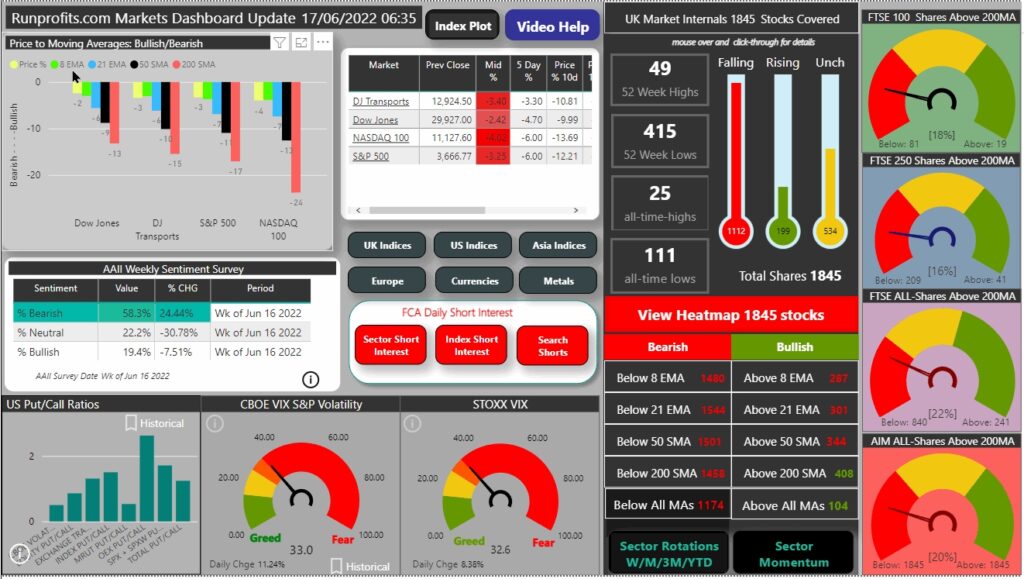
Sentiment extreme bearishness - VIX hit 35 yesterday back to 33 highly elevated. Check the AAII individual investor sentiment now almost 60% bearish with just 19% bullish. Mean reversion suggests some move back to equilibrium.
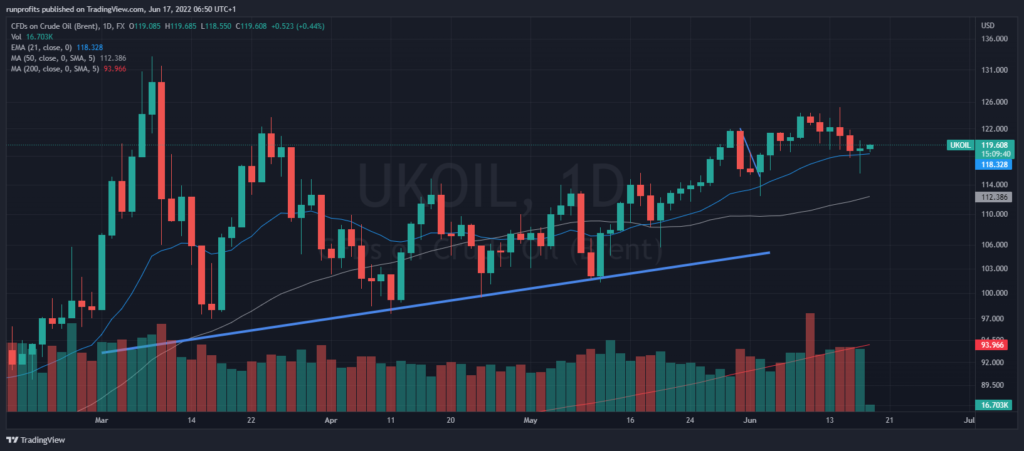
OIl - dipped to the 21EMA (blue line in chart) and then rallied stays bullish
Chart of the FTSE 100 futures is showing some resistance to the 7100 - that which was support. This is both surprising and troubling so one to watch.
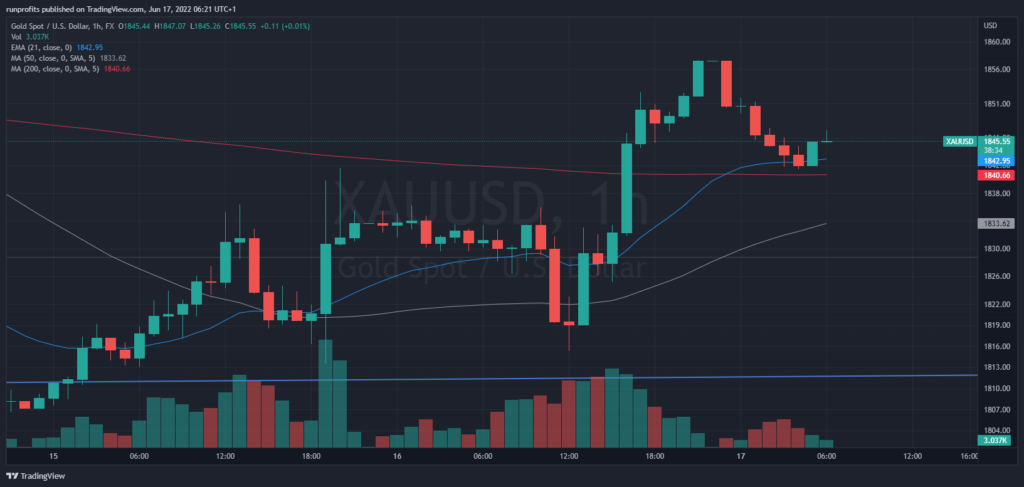
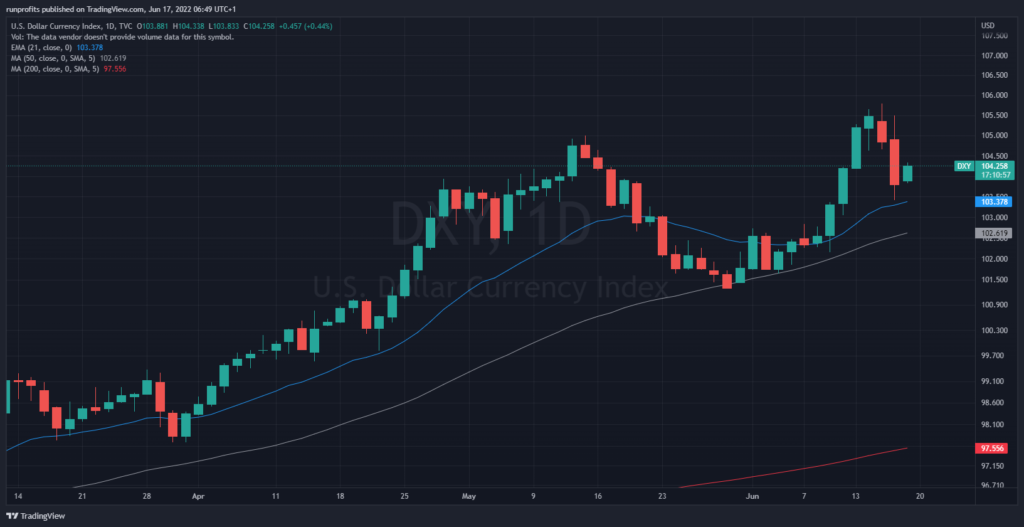
DXY has pulled back and set-up gold for a rally clearing its 200 MA - this yoyo price action may well continue but it has been well behaved and in a tradeable range.
Today should see some relief which may well extend to a few days unless we really are full-on crash though it is rarely this obvious. Markets love to do what most don't expect.These current market conditions call for nimble responses and contracted trade timescales given volatility. It can be confusing, maddening but it's never dull.
Comments Feedback Below
Found it useful? : Show support and hit the Share buttons on the Left
Market Dashboard -Charts - click to open to full size
FTSE 100 Futures
US Stockmap Close
Gold Chart
DXY Chart
Brent Oil Chart

