
09:30 : Bitcoin Breaks $16,000 Level: Breakout in ARB likely to follow
Bitcoin has seen a huge resurgence in 2020 having crashed from the frothy heights of $20,000 in 2018 to lows below $3000 in 2019. Its rise and fall is reminiscent of the hype cycle in new technologies where the promise inflates expectations as "wildest dreams" scenarios are imagined only to see them dashed as reality kicks-in and shortcomings become clear ...there follows a slow recovery from a "trough of despair" to a "slope of enlightenment" when the real-world potential become clearer as the technology is adopted in the mainstream. The psychographics of BTC adoption also parallel those of new technology where the mainstream laggards' continued scepticism become gradually eroded as adoption widens in the final plateau of productivity (or in this case, acceptability).
BTC's adoption by PayPal in Oct '20 marked a significant milestone in the cryptocurrency becoming just currency: its recognition as an asset by the likes of Tudor-Jones and more recently JP Morgan, who have recently established a crypto unit (see Oct 20, a spectacular volte-face from JPM's Dimon calling it a "fraud" in 2017) and the increasing exposure sought by large hedge funds and institutions has further marked this coming-of-age.
The volatility in BTC has decreased markedly from those over-hyped days as many of the scam artists and shysters have moved on to other cons (the con with BTC being the "get rich" in minutes fantasy along with fictional ICOs - initial coin offerings that literally cashed in on the craze.). There is no doubt that many will remain deeply skeptical of BTC as an "asset class" often referring to it as imaginary and without value: given the trillions printed in fiat currency this year, the principle difference between both "asset classes" is less the imaginary nature of the intrinsic value and more the basis of their supply and reserve: BTC is both finite in supply and increasingly difficult to mine (tied to a unmovable limit of 21 million BTCs minable) ; while fiat remains ostensibly infinite in supply and increasingly facile in generation. That argument doesn't extend to demand where the dynamics reverse
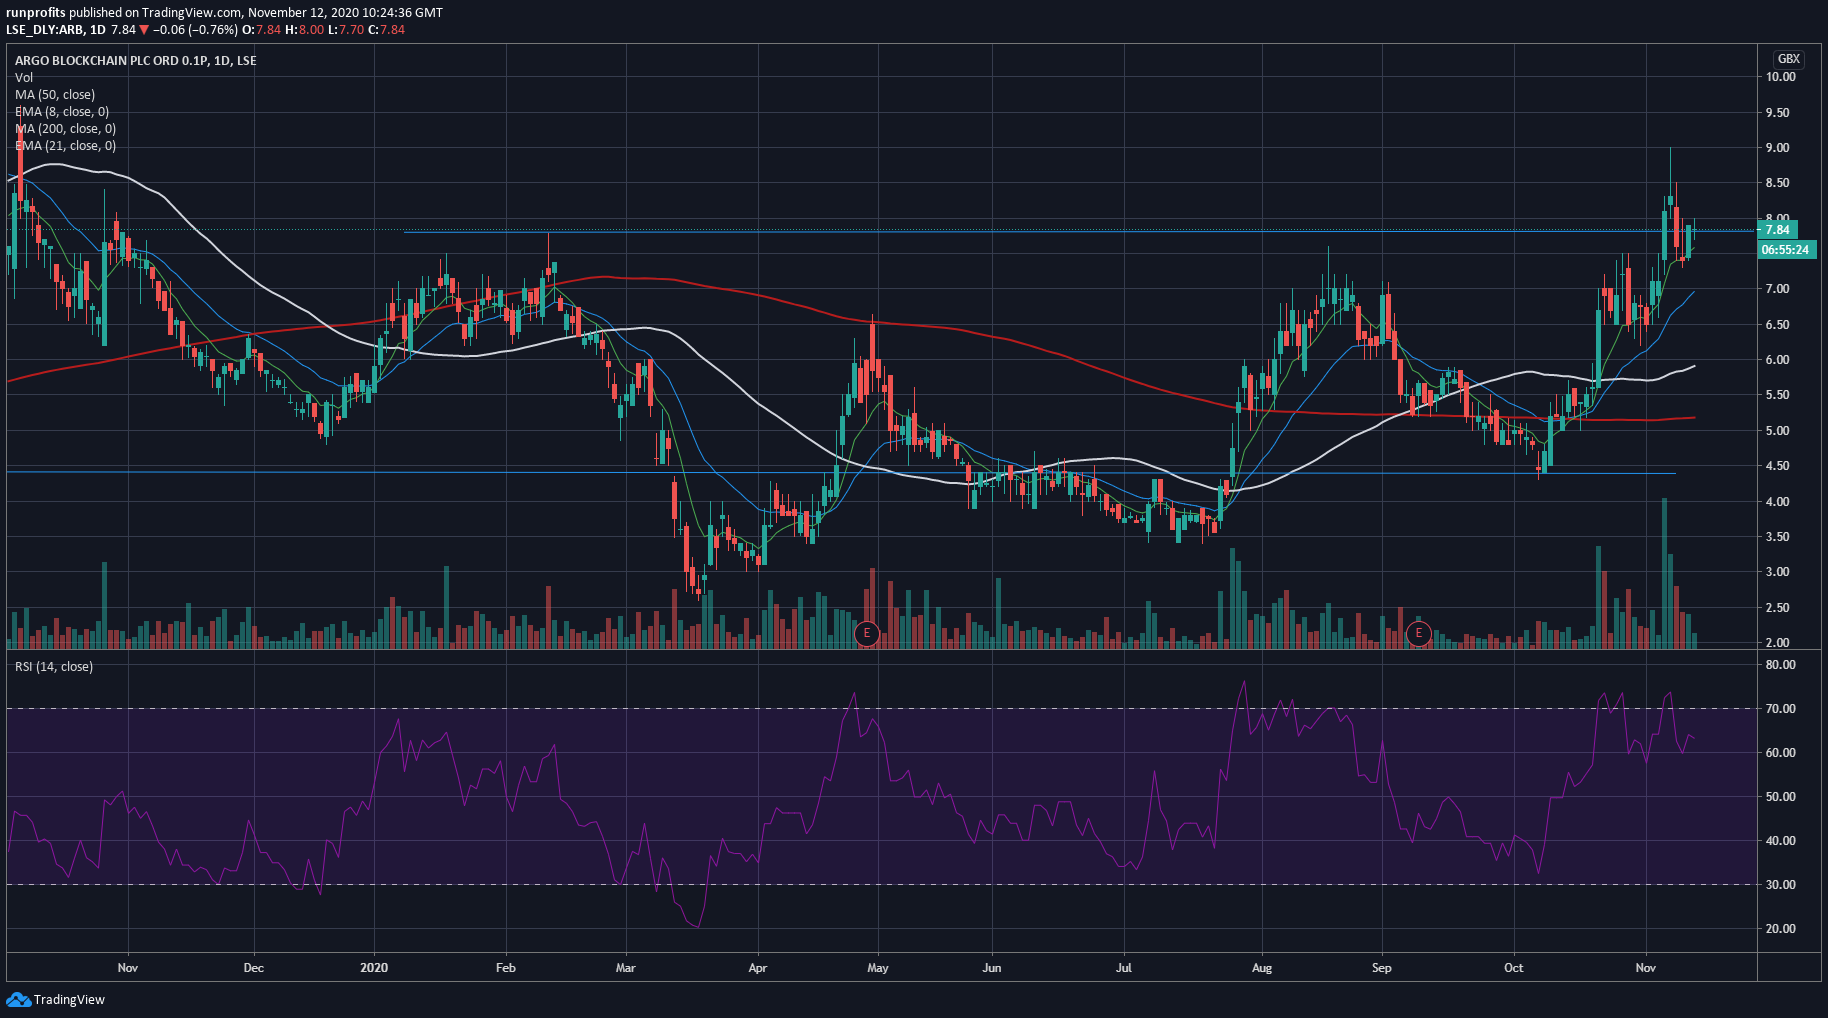
I don't trade BTC nonetheless but I have ,and do, trade Argo Blockchain a tiny £21m market cap crypto miner based in the UK. At pixel ARB's price is 7.8p, apparently ignoring the significant breakout in BTC but does looks likely to follow and clear the recent 9p high. ARB has completed a classic 8 EMA check-and-bounce pullback common in many accumulated shares . The chart below also shows volume accumulation on days when price increases but much lower volume on days when price decreases.
Assuming BTC holds these levels and closes above $16,000, ARB looks likely to follow (with caveats on increasing mining difficulty and relative hash rates as BTC price rises ). ARB's lacklustre price action is probably a function of its relative obscurity to UK investors and the residual scepticism of BTC's merit which is more predominant in the UK than the US.
[stock_market_widget type="inline" template="generic" assets="ARB.L" markup="{name} ({symbol}) {price} ({change_pct}){last_update}" style="font-size:x-small" api="yf"]
Pre Market 07:15 Update: Pullbacks Ahead, UK GDP Bounceback
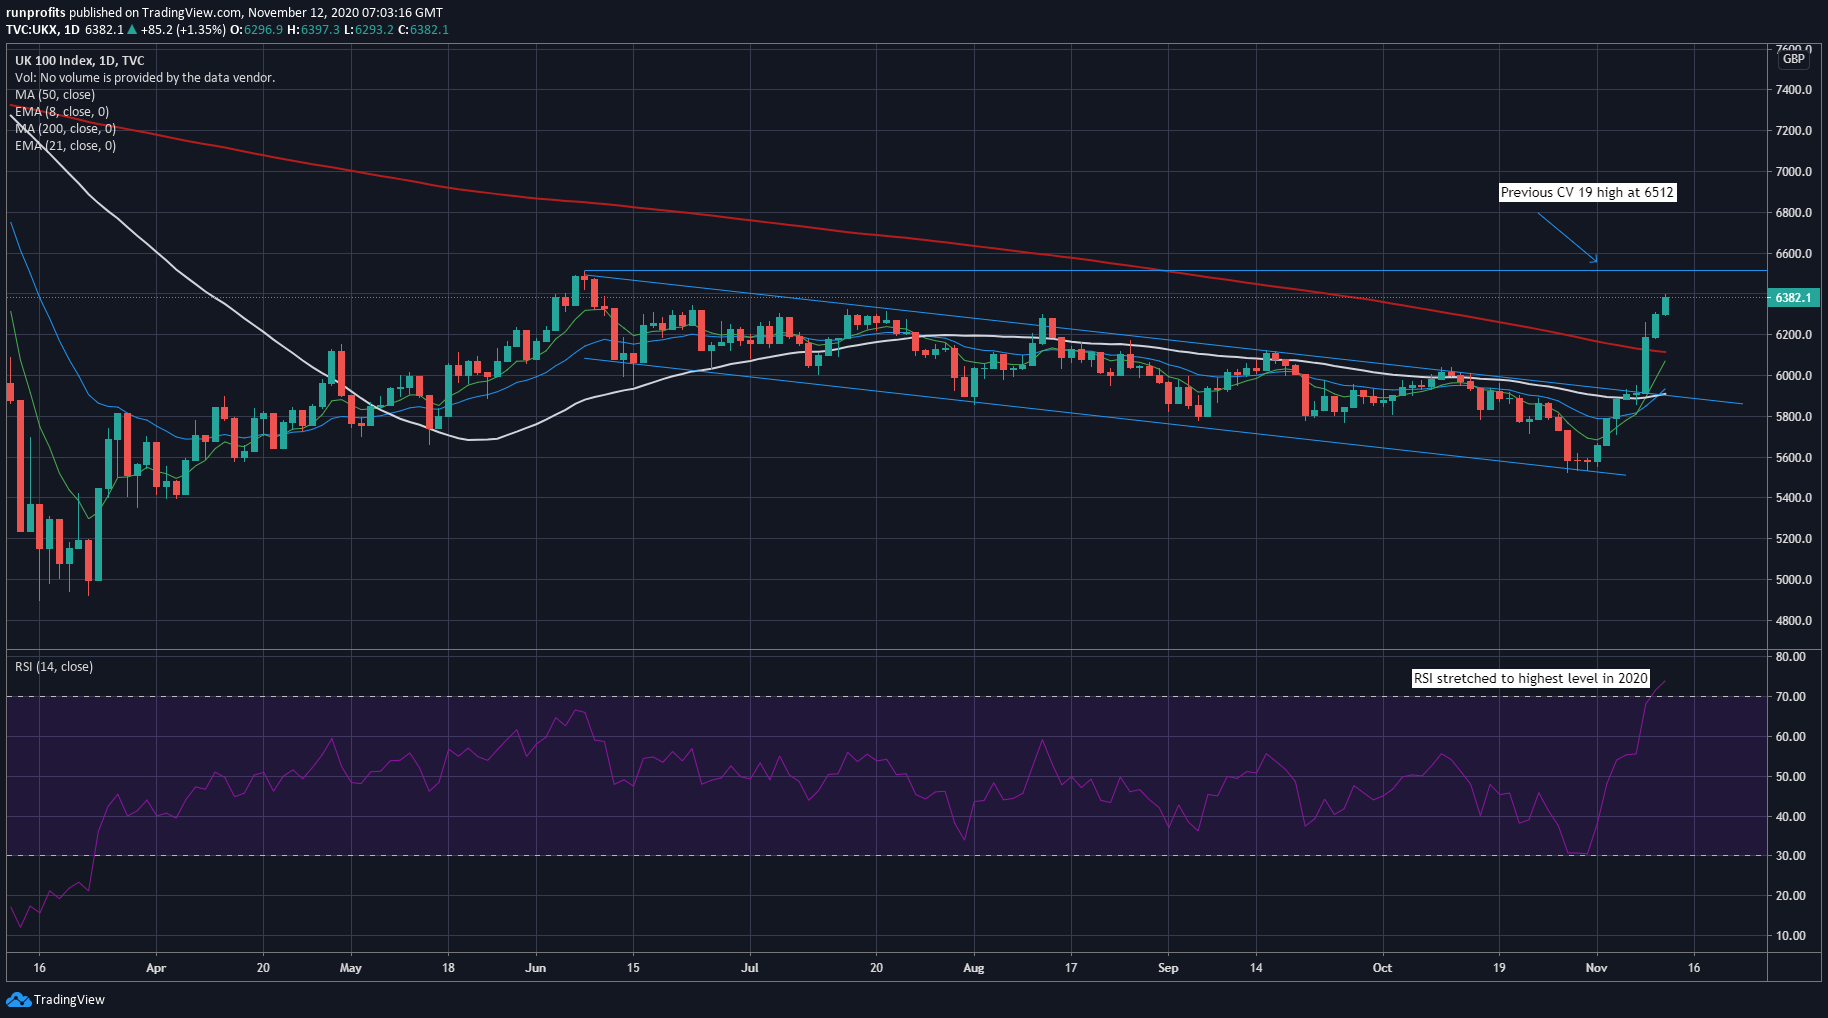
FTSE 100 futures signal cash will open some 70 points lower at 6330 as the index has stretched its gains over the past week adding 14.5% in just 10 days. The RSI (relative strength index) is at the highest level since Jul 2019 : this is an indicator of the overbought nature of an instrument and signals a reversion to mean is likely (see FTSE 100 chart below).
- VIX drops to 23 as Fear Index turns to more Greed at 66.
- Asia close mostly lower after a mixed Wall Street saw tech come back with the DOW closing flat on the day.
- Oil remained firm overnight having given back some gain yesterday but steadied on inventory releases: copper continues to be resilient while gold has held the 1870 level but still looks weak with a bear flag forming suggesting more selling may be ahead.
- Q3 UK GDP bounced back from -19% in Q2 to +15.5 in Q3 lower than the expected 15.8% while both Industrial Production and Manufacturing Production were lower than expected (see calendar).
- These are likely to weigh on overbought indices and contribute to today's pullback.
- Several of the FTSE 100 go ex-div today including RDSB, GSK, FERG, RSA, SBRY: these drag on the index : there are also numerous 250 names ex-div

Pre Market 07:15 In Charts
FTSE 100 adds another 1.3% to stretch gains increasingly looking overextended and due a pullback and consolidation of the recent gains
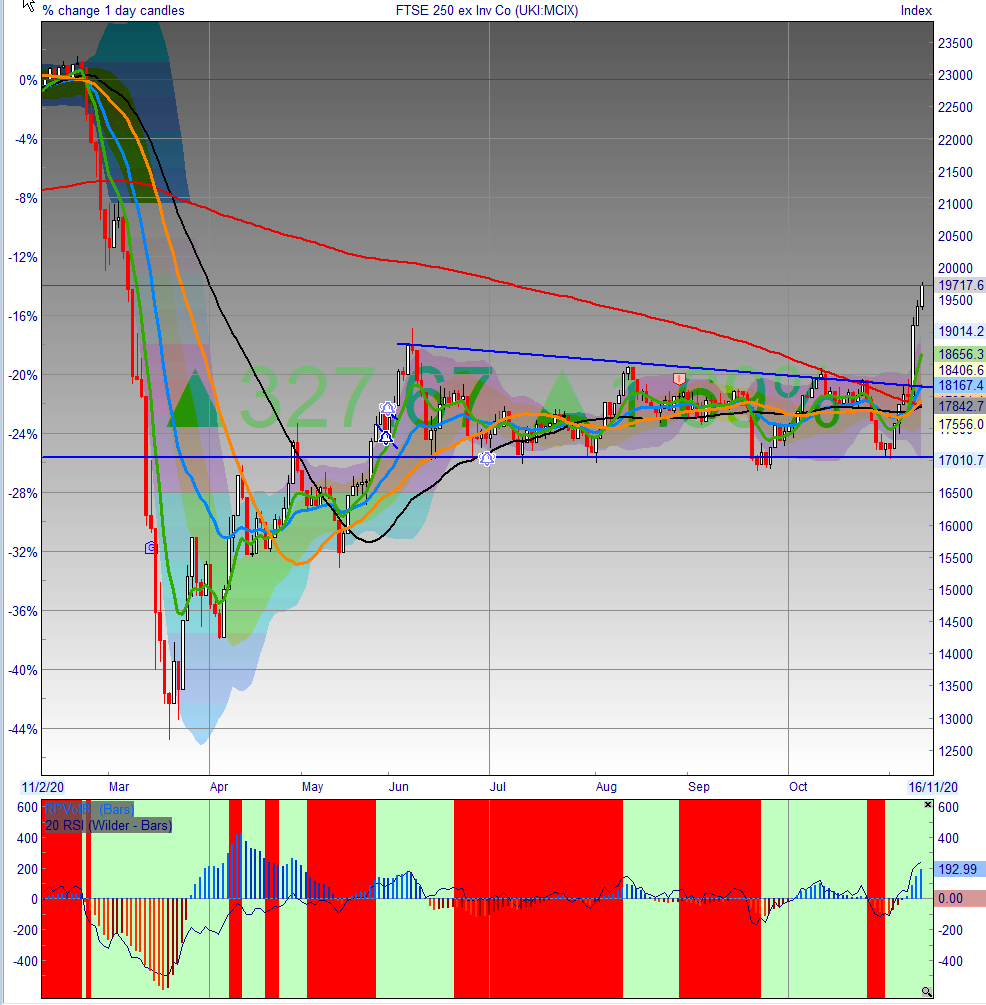
FTSE 250 has broken-out to new post CV19 Highs
AIM All-Share set to test recent post CV19 highs though with decreasing momentum
FTSE 100
FTSE 250
AIM All Share

