
 2020 So far for UK Indices, Commodities, Sectors & Stocks UPDATED Every Friday EOD
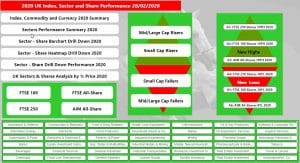
Interactive data report of performance across major UK assets classes YTD with individual sector breakdowns allowing quick visual determination of relative strength.
click to view the report
New in Sentiment Dashboard: Find Shares Rising and Strongest Trend
In these turbulent times find what’s working quickly!
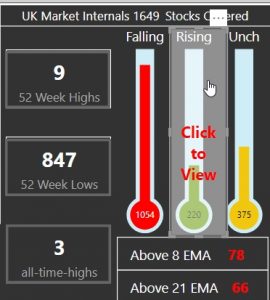
Market sentiment dashboard now includes reports on
- shares rising and falling
- shares that have price above all moving averages.
Click through the centre panel roll-overs to view
click to view the report

Video Guide to Using runprofits
Part 1 : Introduction to reports on RP: navigation and basic analysis

Video Guide to Market Sentiment Dashboard
Detailed guide to help you unlock the power of the dashboard's analysis
Three Part Video to help you unlock the power of the analysis and inform your trading and investing
FEATURE ARTICLE. UK Markets 2019 - A Lookback : Exceptional Bull or the Case for a Catch-Up?

This article takes a look beneath the numbers and contextualizes the 2019 performance in terms of recent years and in direct comparison with that of 2018. 2019 was a year that greatly favoured the mid and large caps while punishing many of the small caps. Almost half of the FTSE 250 shares made new ten year or all time highs in 2019 with 40% of the FTSE 100 doing similar ..
.....in stark contrast 40% of the AIM All-Shares made ten year or all time lows.
RP Scanner Identifies a 40% Pop - Short Squeeze Reversal in MTRO: Wed 06 Nov 19
 MTRO came up on the RP Scanner Short Trade Ideas on Friday 1 Nov as a potential reversal having made a 14% intraday price move: it went on to rally almost 40% in three trading days this week in a classic short squeeze reversal play.
Going for Gold August 2019: Trading Gold with Spreadbetting
 The yellow metal has had a stunning run over the past few months and is currently up over 18% YTD making it one of the best performing “assets” of 2019. This article takes a look at the charts, identifies the set-ups and discusses trading spot gold using spread betting
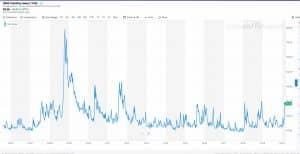 What is the VIX and Why is it Significant?
This short article explains how the VIX is measured, what is means and how it can sometimes be used as a contrarian indicator of market sentiment.
Burford Capital: A Reversal of Fortunes Aug 2019
 This short article analyses the price action of Burford Capital before it tumbled over 60% in one day on 7 Aug 2019 following a short attack. The article highlights a number of technical warning signs that preceded the attack and illustrates how technical analysis can help evade disasters.
Summer Storms 2019: Analysis of Indices and Sectors Aug 2019
 Volatility over the past few weeks has resulted in very significant market moves with drops of 10% or more in some of the indices and larger in individual stocks. The AIM Markets have given back almost of all of their gains for 2019 while the FTSE 100 and FTSE 250 have outperformed
Analysis of 541 IPOs Part 2: “D” Listers, Frauds, Buy-Outs and Nomads
 Part 1 of this series identified 133 missing IPOs over the period studied: these were tracked down in Part 2 and the results weren't pretty. Almost half had delisted, one third were bought out while others had changed names, changed markets, gone back to private companies or were frauds. 25% of the 133 yielded a profit while 75% were a loss.
Analysis of 541 IPO Placings . Part 1: Assassins and Rabbits; Multibaggers and Dogs.
 408 IPOs from 2011 to 2019 were analysed quantitatively: the median return was -17% with a 60:40 split of losers to winners over the time period. This study proves with numbers that most IPOs lose money and often lose big: a few make money and do extremely well. A stop loss removes most of the dross and keep the multlibaggers
Sentiment Dashboard: Coronavirus Data from WHO, Bullish /Bearish Sectors
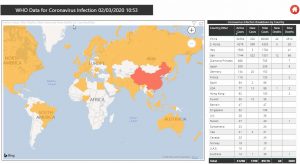 Market sentiment dashboard now contains summary data for coronavirus outbreak with a full page breakdown by country and incidence.
The dashboard now also provides one page summaries of each UK stock index with breakdowns of most bullish and bearish sectors and shares to quickly identify winners and losers.