Pre Market- 0645 : US S&P New ATHs Nvidia +16% : German GDP at 0700
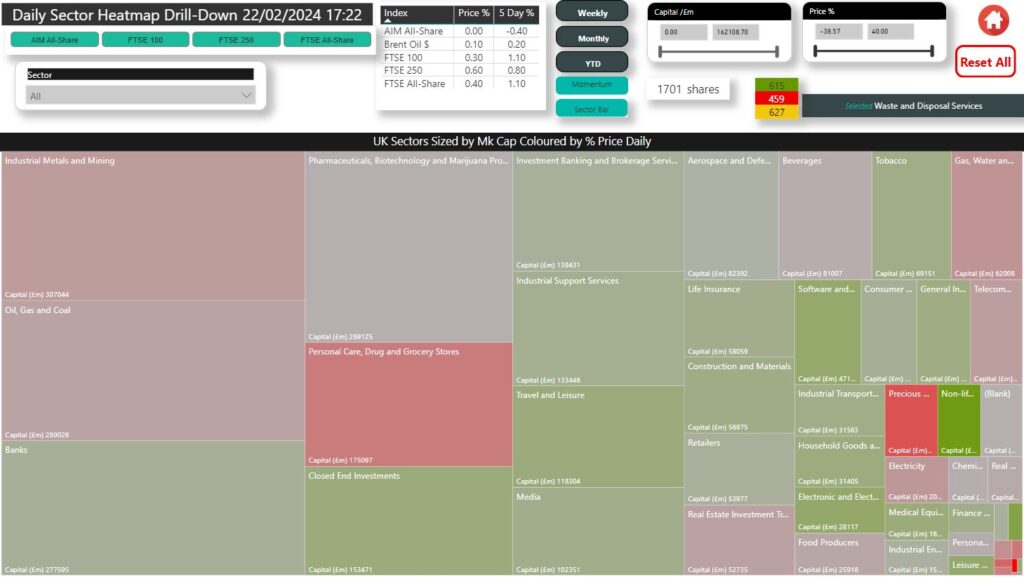
In the UK yesterday out performance from the mid cap FTSE250 up 0.6% - a lot of this down to the +22.5% pop in INDV : second in line was FTSE100s at 0.3% and AIM was unch on the day if you see below on the heat map we had about 600 buying, 450 selling and 630 doing nothing.
Selling concentrated in Miners, Oilers , Personal Care while many of the other Pharmaceuticals didn't have a good day (AVCT lost 12% , POLB 10%) nor did Utilities and Precious Metals Miners had a particularly bad day with the likes of VAST, SLP selling off.
in the green we had Banks again as LLOY reported and popped 6% , Construction, Software and particularly outperformance in the Non Life Insurance so it's good sector to have a look in there's tonnes of strength in there.
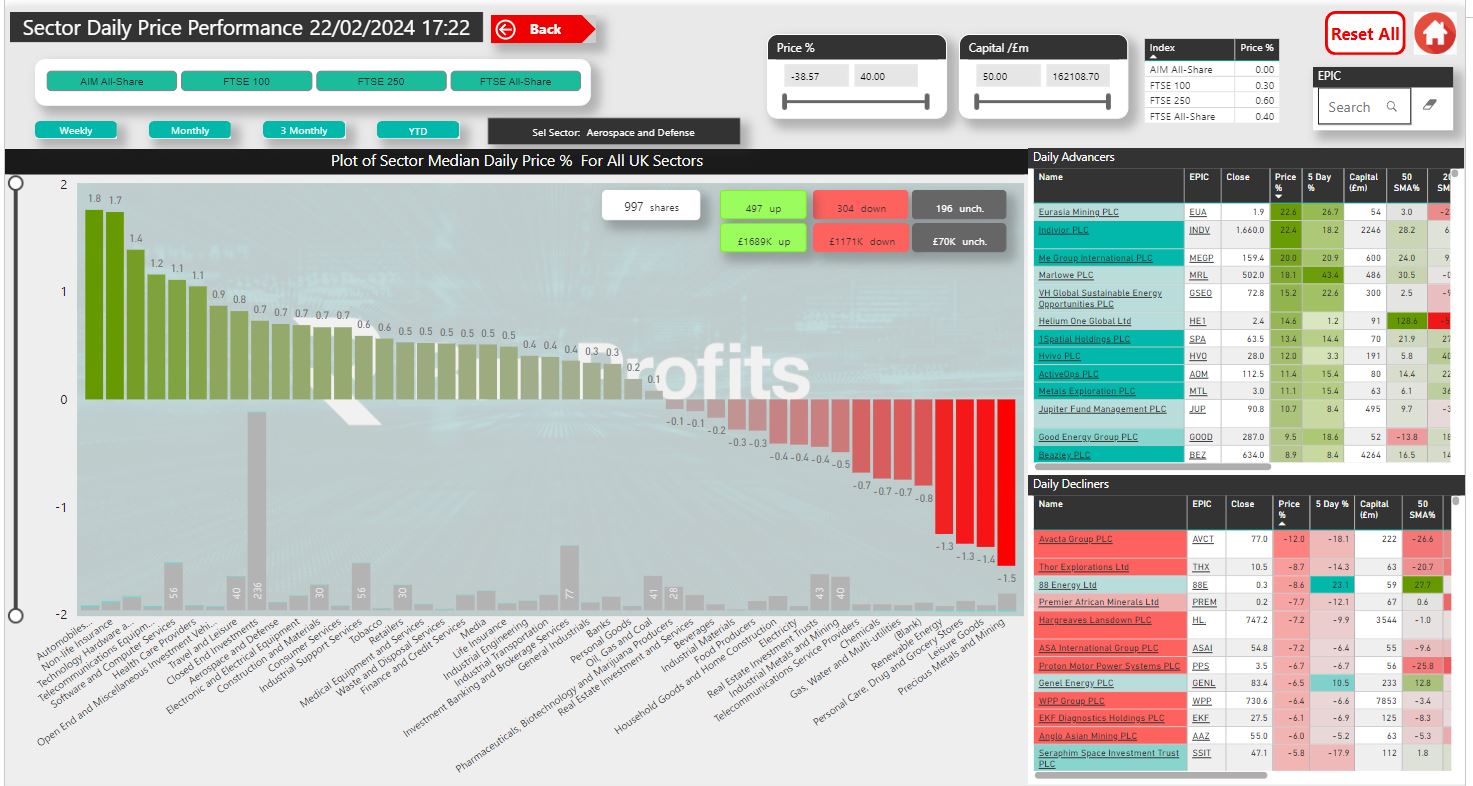
The below is from the Market Dashboard it's under sector rotations) and this gives a summary of the main advancers and decliners which you can segment by the indices and that gives you a very quick view on the best performers and the worst performers. Indivior dwarfing the other major movers with an enormous difference in market capital
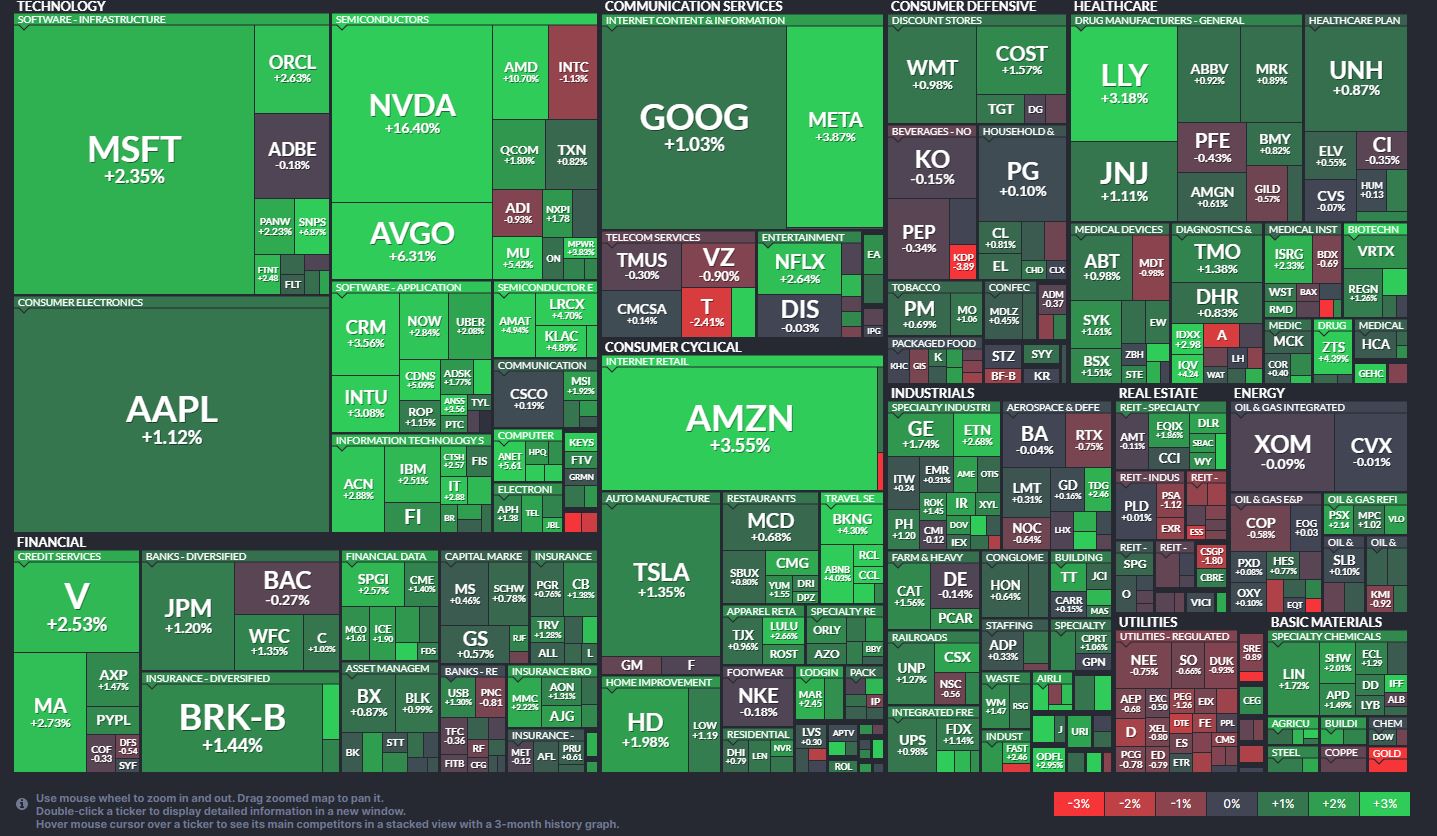
In the US markets closed in at record highs for the S&P +2.1% and in Japan and Germany - US saw most green in the semis and technology
The dollar Dollar index briefly dipped below 200 day moving average yesterday but recovered and is continuing to trace along the 21 EMA the blue line in the below chart Just shy of the 104 level
In commodities , Brent crude remains rangebound Into resistance above the $83 level, gold struggled with resistance at the 50MA and has pulled back remaining in a tight range ,
Similarly copper remains in a tight range With the platinum group metals similarly relatively unchanged while uranium spot has slipped below the $100 mark.
Bitcoin continues sideways but slips below its 8 EMA
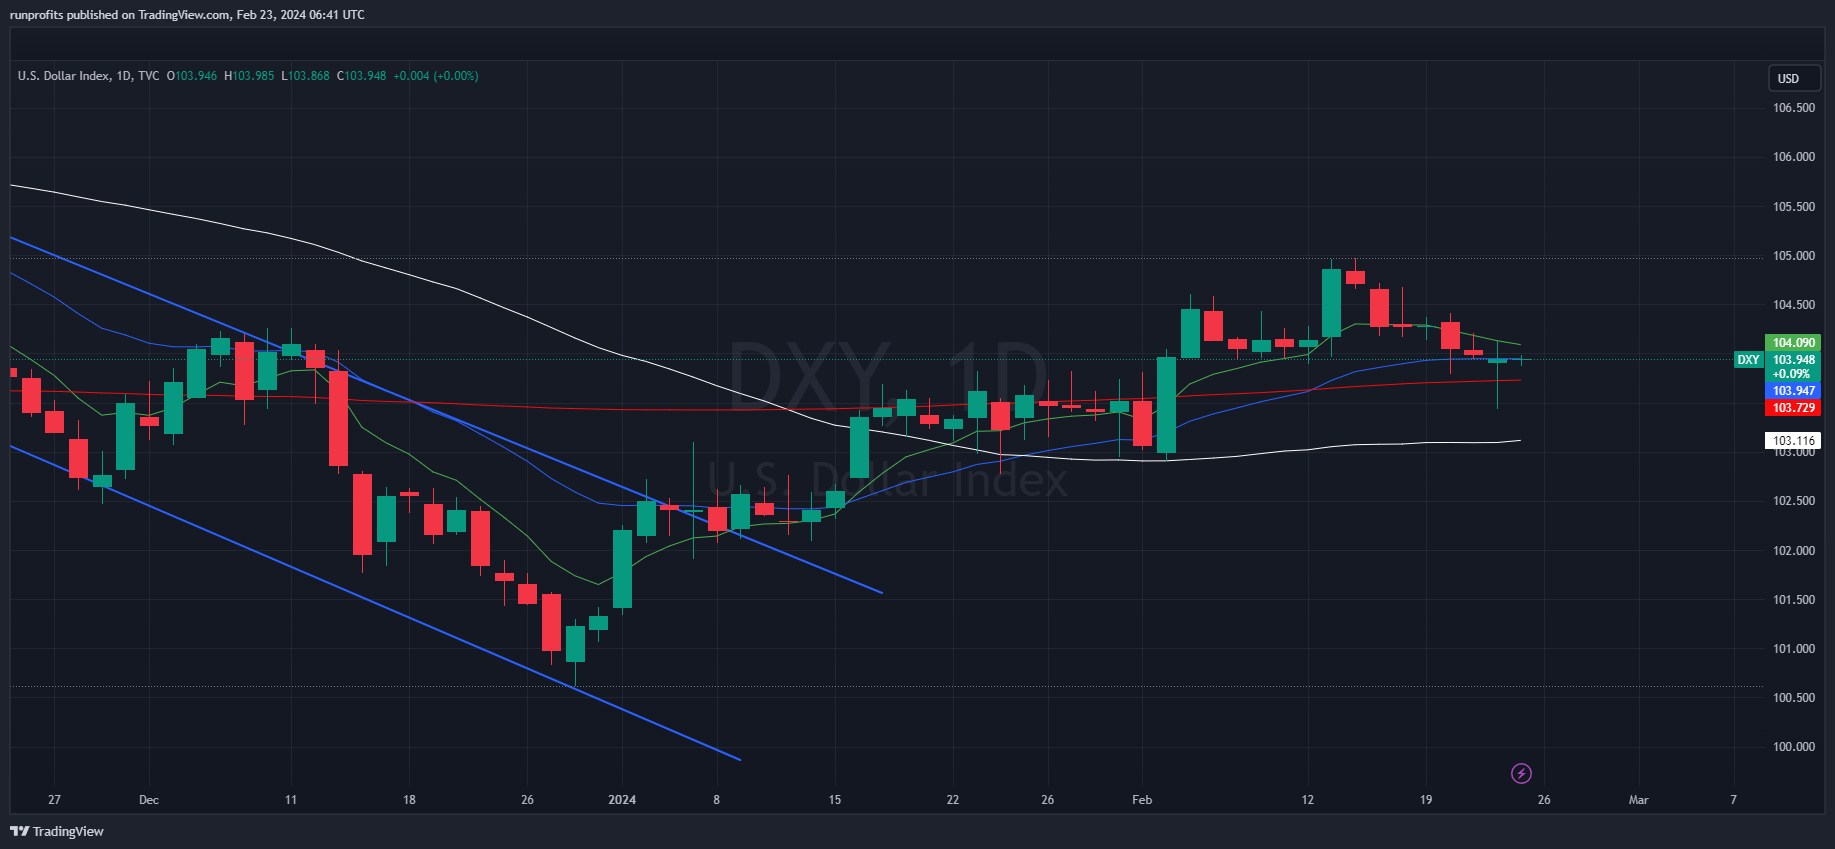
Dollar index
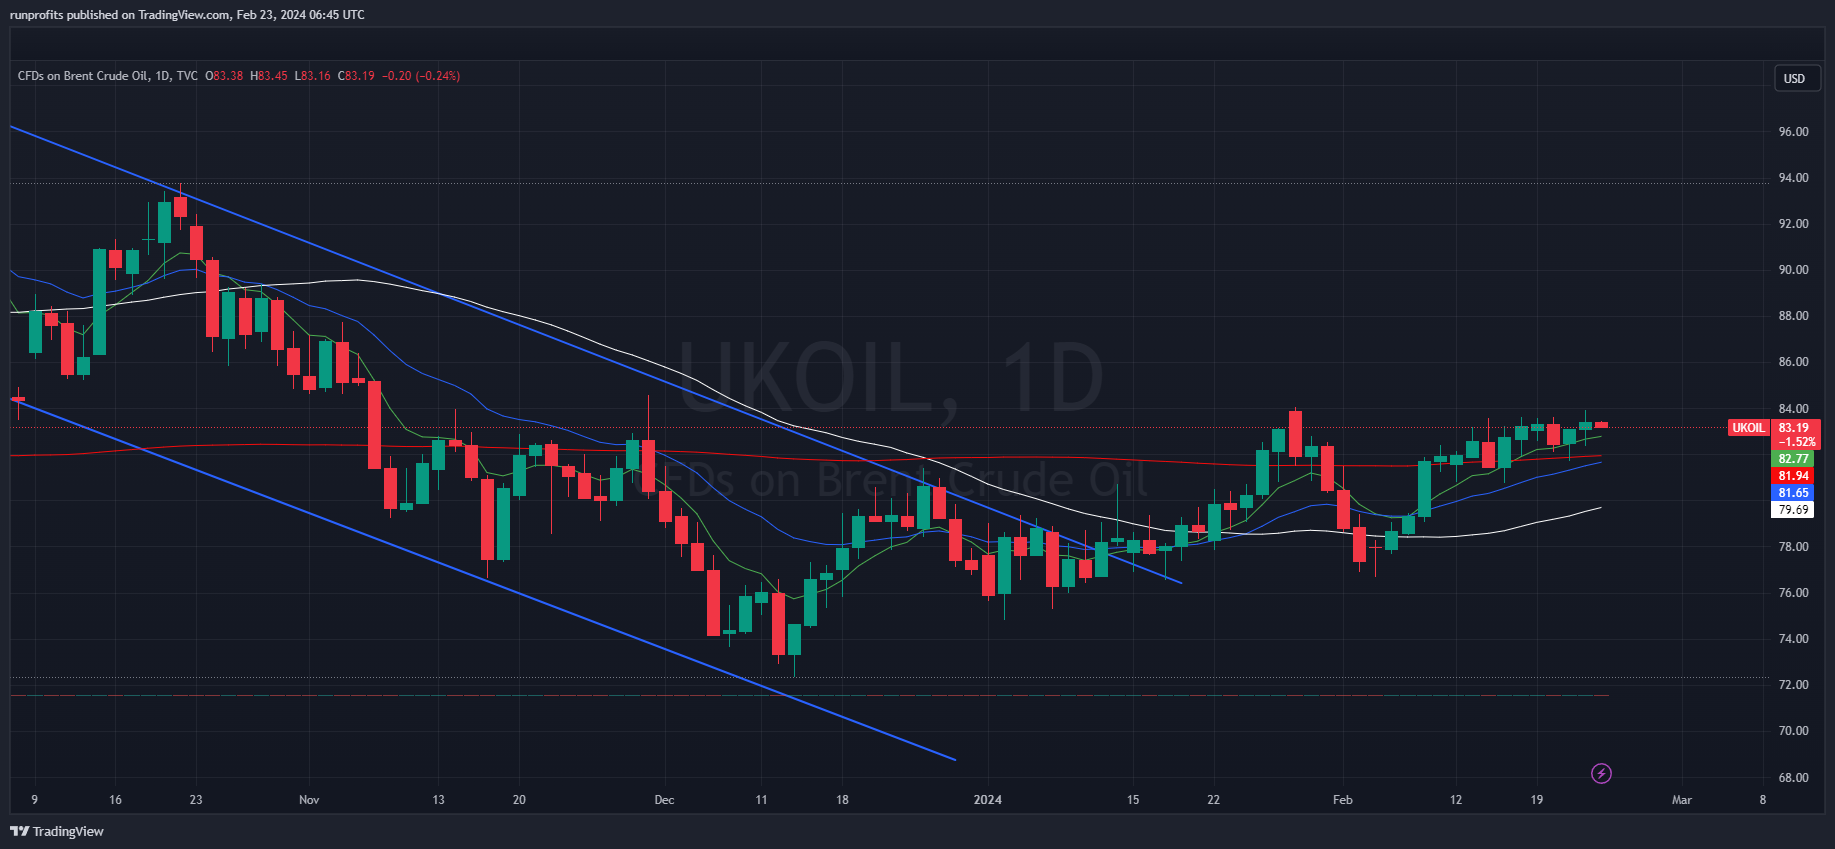
Oil remains resistance above $83
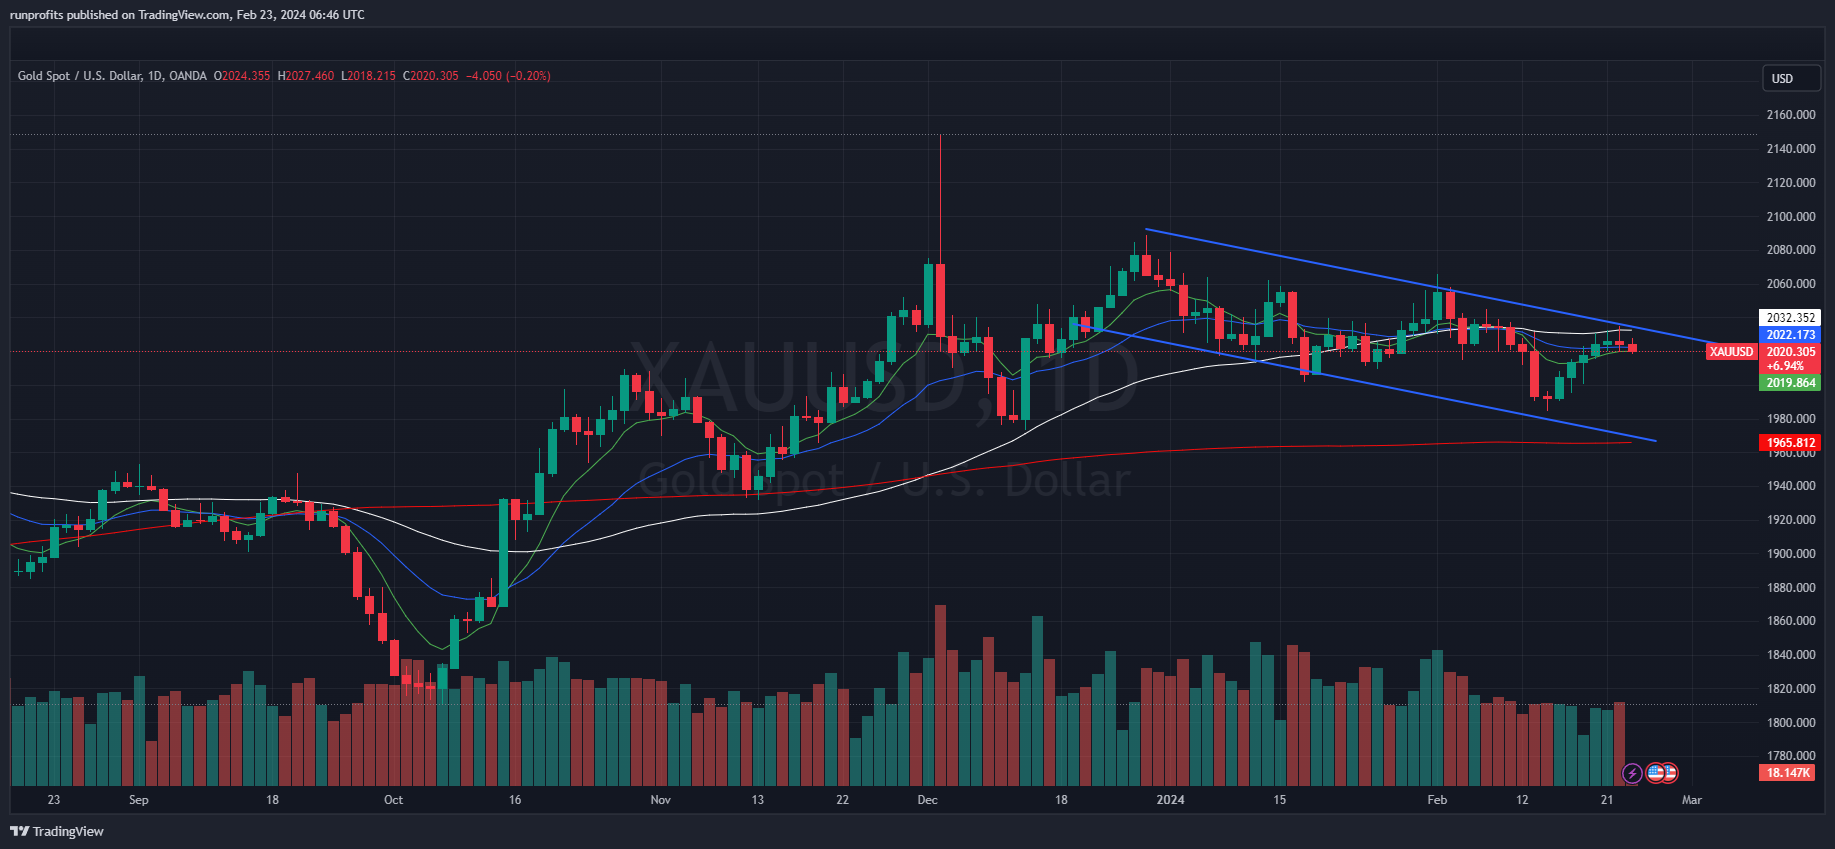
Gold finding resistance at the 50 MA level
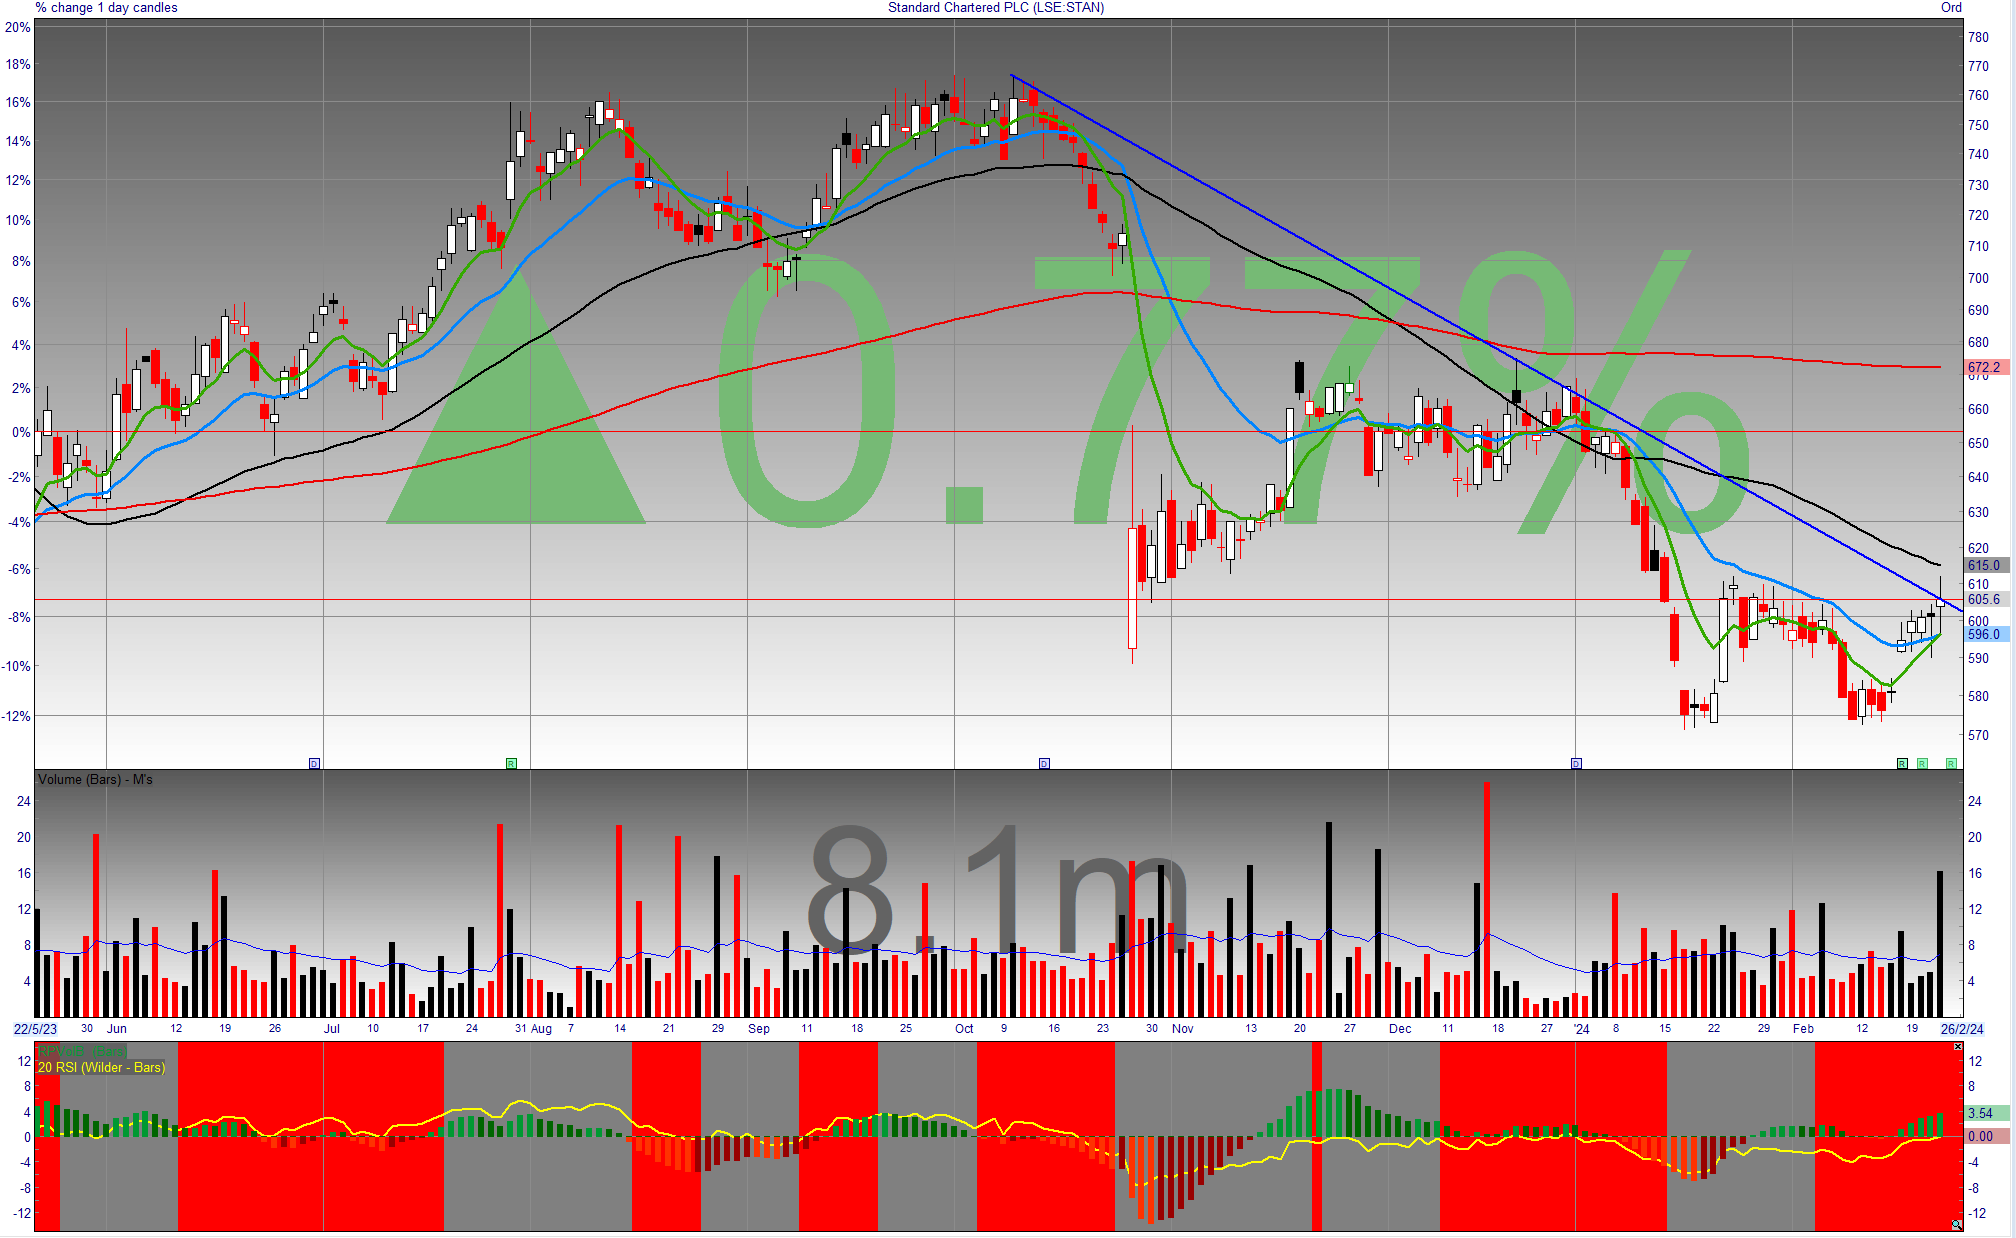
One to Watch STAN: The Next Bank to Pop
Standard Charter looks set to be the next bank to pop this week : profits +19% YoY NIMs up 17% operating income +10% and announces a $1bn share buyback.
Chart shows run up to these results yesterday with volume build set for a breakout today and likely gap above the 50MA black line at 615p