Contents: Click on Link to View
Toggle
Please add me to runprofits.com mailing list for future articles and trade ideas
Bitcoin Set to Breakout? Long ARB
Bitcoin looks poised to make another attempt at the $10,000 mark having rallied from below $7000 at the start of 2020. Despite its wild and reckless past, BTC is showing a bit more maturity and less volatility in the past few months having dropped from 2019 highs of almost $14000 to below $6500 in December 19. Its orderly rally form this low point over the past 3 months is more suggestive of a concerted trend rather than a frenzied roller coaster ride. This may in part reflect the maturity of the cryptocurrency space, the increased involvement of financial institutions and the derivatization of crypto into ETFs and funds
Using Page 21 of the RP Scanner allows you to search the full database of 1646 shares by activity or keyword.
There are 3 AIM shares with BTC related activities but only two pure plays namely OBC and ARB . ARB has recently provided both a trading update and operational update and is doubling its crytpo mining capacity in Q1 2020. Having pulled back from a high of over 11p on Sep '19, ARB has been basing and looks to be forming a cup and handle reversal pattern . click to view chart
A concerted break of BTC above £10,000 would signify the clearing of some major resistance and likely trigger a rally in ARB, which given its C&H pattern looks set to go
Updated 16:10
Short Interest Shares on the Move
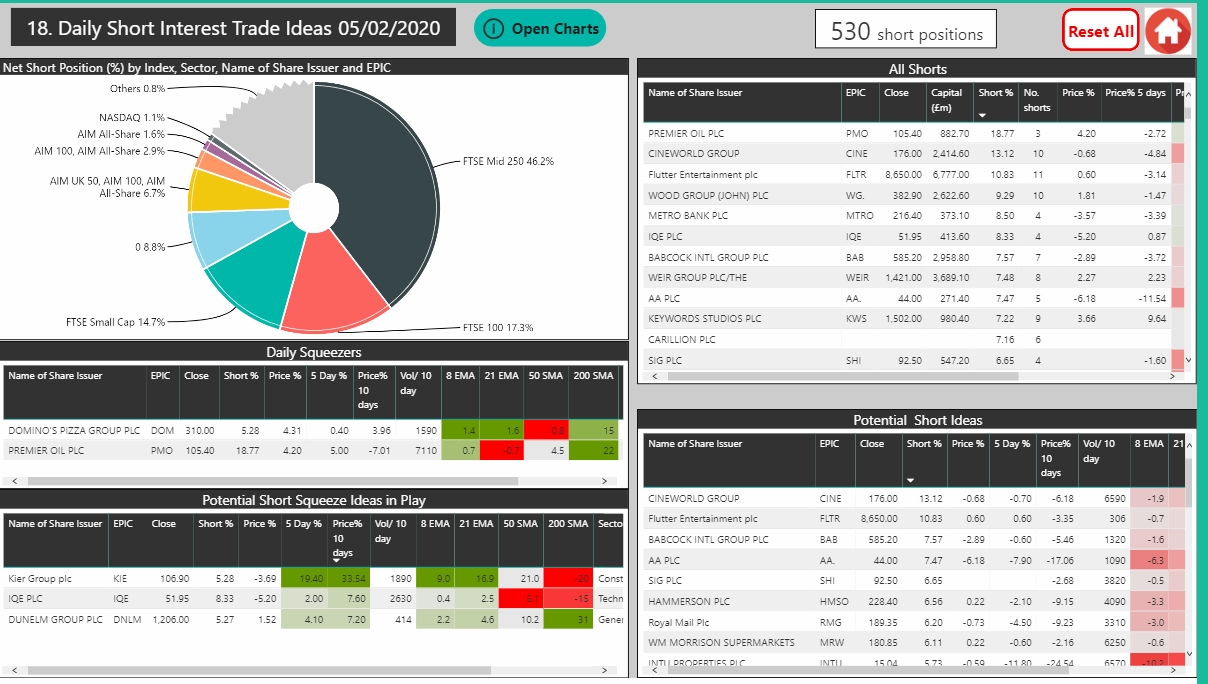
Page 18 of the RP Scanner tracks shares with high open short interest with unusual price momentum to highlight potential short squeeze situations. A short squeeze occurs when shorters look to close short positions quickly owing to some change in the fundamentals or good news for the share being shorted. The sudden increase in demand to buy shares and cover short positions gives rise to a price spike often on high value
the RP scanner integrates FCA short interest data and then mines for shares with high open interest showing positive price momentum : WARNING: These are often high risk scenarios where rapid reversal can occur. Only trade these with small positions and a huge focus on risk management
Last Friday RP Scanner identified KIE as a potential squeezer: Kier has rallied 30% in the past few days
The Short Squeeze detector is currently showing DOM, PMO , KIE and IQE as potential candidates
The Scanner is updated daily and is well worth checking back for ideas on explosive moves
Updated 15:00
Figure 4 Potential Short Squeezes
Oilers Fading a bid - Hurricane in a Storm
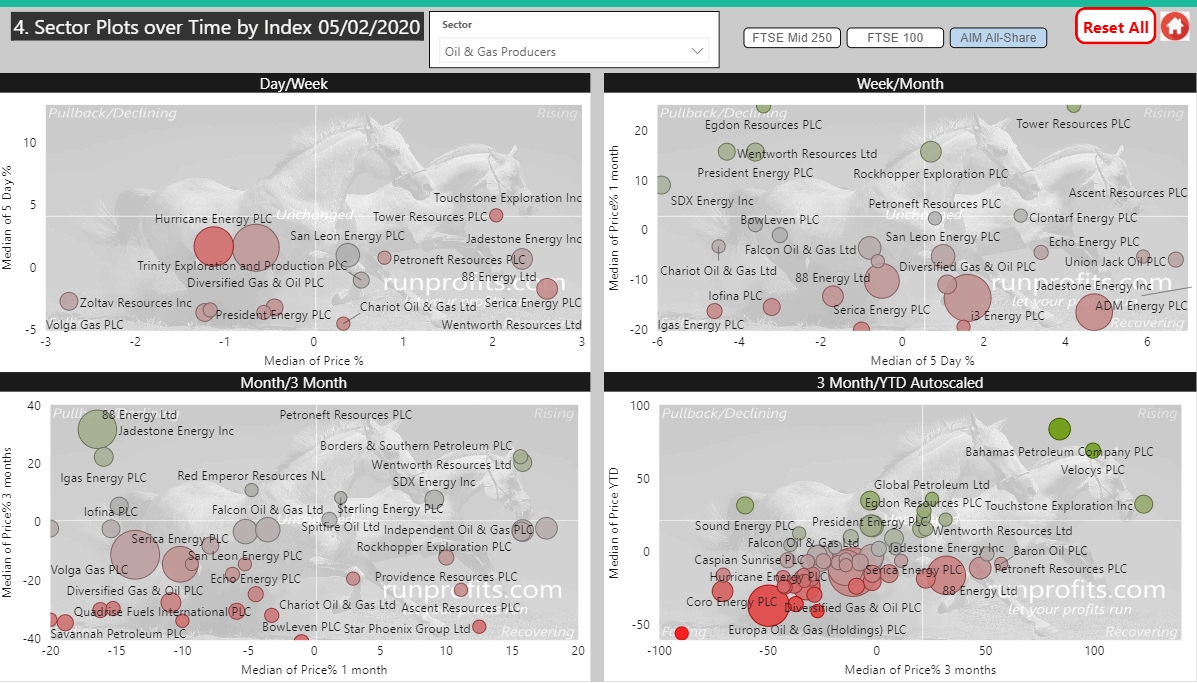
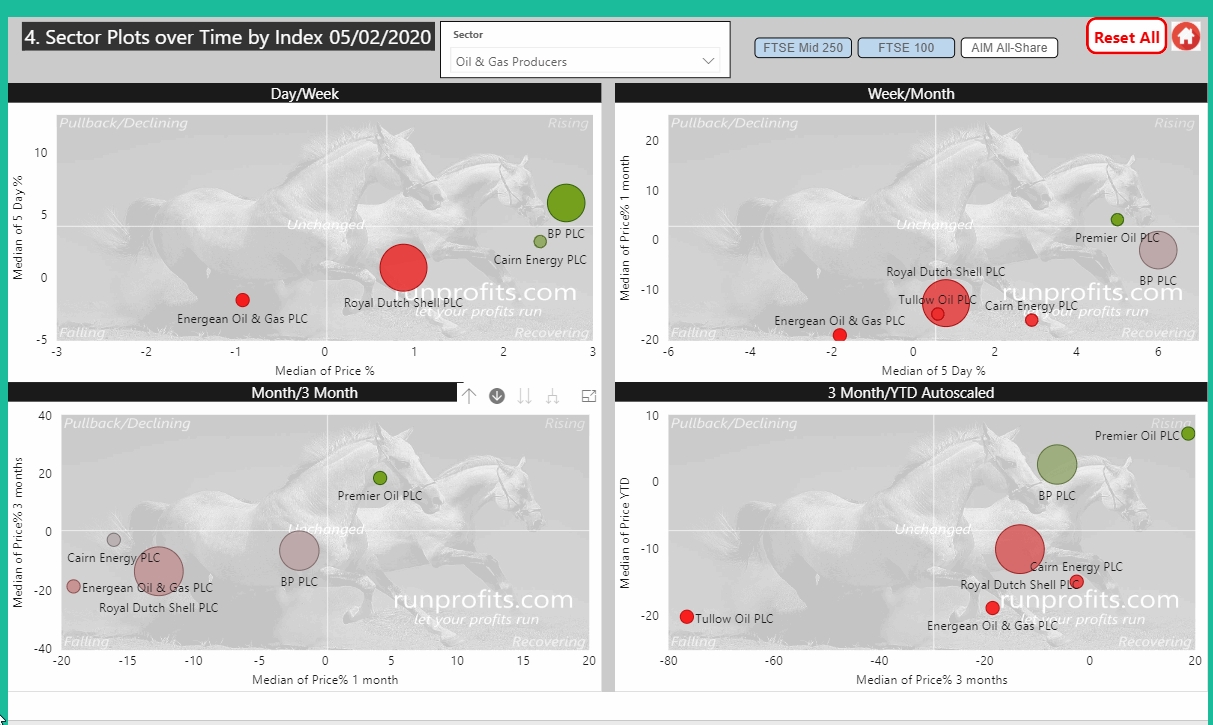
Oil and gas caught a slight bid yesterday up 0.4% with BP. continuing to rally off its recent results up 6% in 5 days. Crude did an about turn today giving back 1.6% with Brent dropping below $55 taking the sector with it curenlty down over 1%
Figure 2 shows big oil in the FTSE 100 and 250 only PMO and BP. offer much green in a sea of red while Figure 3 shows the AIM junior oilers
HUR issued a disappointing operational update this am opening gap down almost 16% adding to its recent woes with a share price of 17.9p from highs last June of 64p
Figure 3. Junior Oil in the AIM
Figure 2. Big Oil in FTSE 100 and 250
US Back on Highs: Commodities off Lows
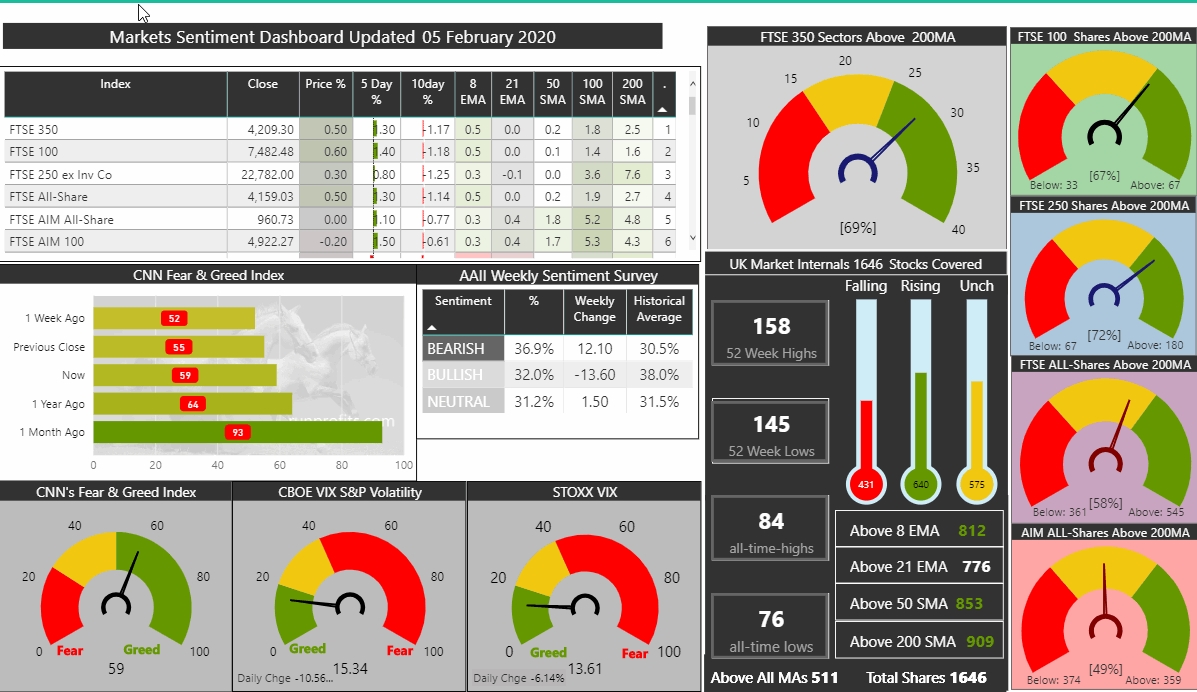
The US NASDAQ and S&P 500 rebounded sharply yesterday revisiting and breaking their previous all-time-highs: indeed market sentiment as measured by our aggregate dashboard showed the VIX falling to around 15 while all of the UK indices put in a day in green and, with the exception of the TechMARK are all back in bullish form across all timescales. 511 of the 1646 UK stocks covered by RP are bullish on short medium and long term timescales. For now, FOMO has won out and the pullback seems to have been resoundingly bought by those on the sidelines waiting to get in
The sentiment dashboard on runprofits aggregates data from across markets and presents these on a summary page. This allows an at-a-glance overview of how the market is feeling (its sentiment). The UK continues to lag the US indices but yesterday saw a broad rally as market recovered from the recent pullback: indeed there were almost equal numbers of 52 week highs to 52 week lows (158 versus 145). Tables of ATHs, ATLs and 52 week highs and lows can be accessed by clicking through on the dashboard. This can provide ideas for long and short trades based on breakouts and breakdowns from previous ranges
Oil rallied almost 4% while copper and iron ore helped lift the mood in the commodities complex so that industrial metals was the outperforming sector from yesterday with EVR, FXPO and JAY all adding 3-5%
Updated 12:05


Figure 5 Argo Blockchain Set to Rally