Contents: Click on Link to View
Toggle
Please add me to runprofits.com mailing list for future articles and trade ideas
Is there blood in the streets yet?
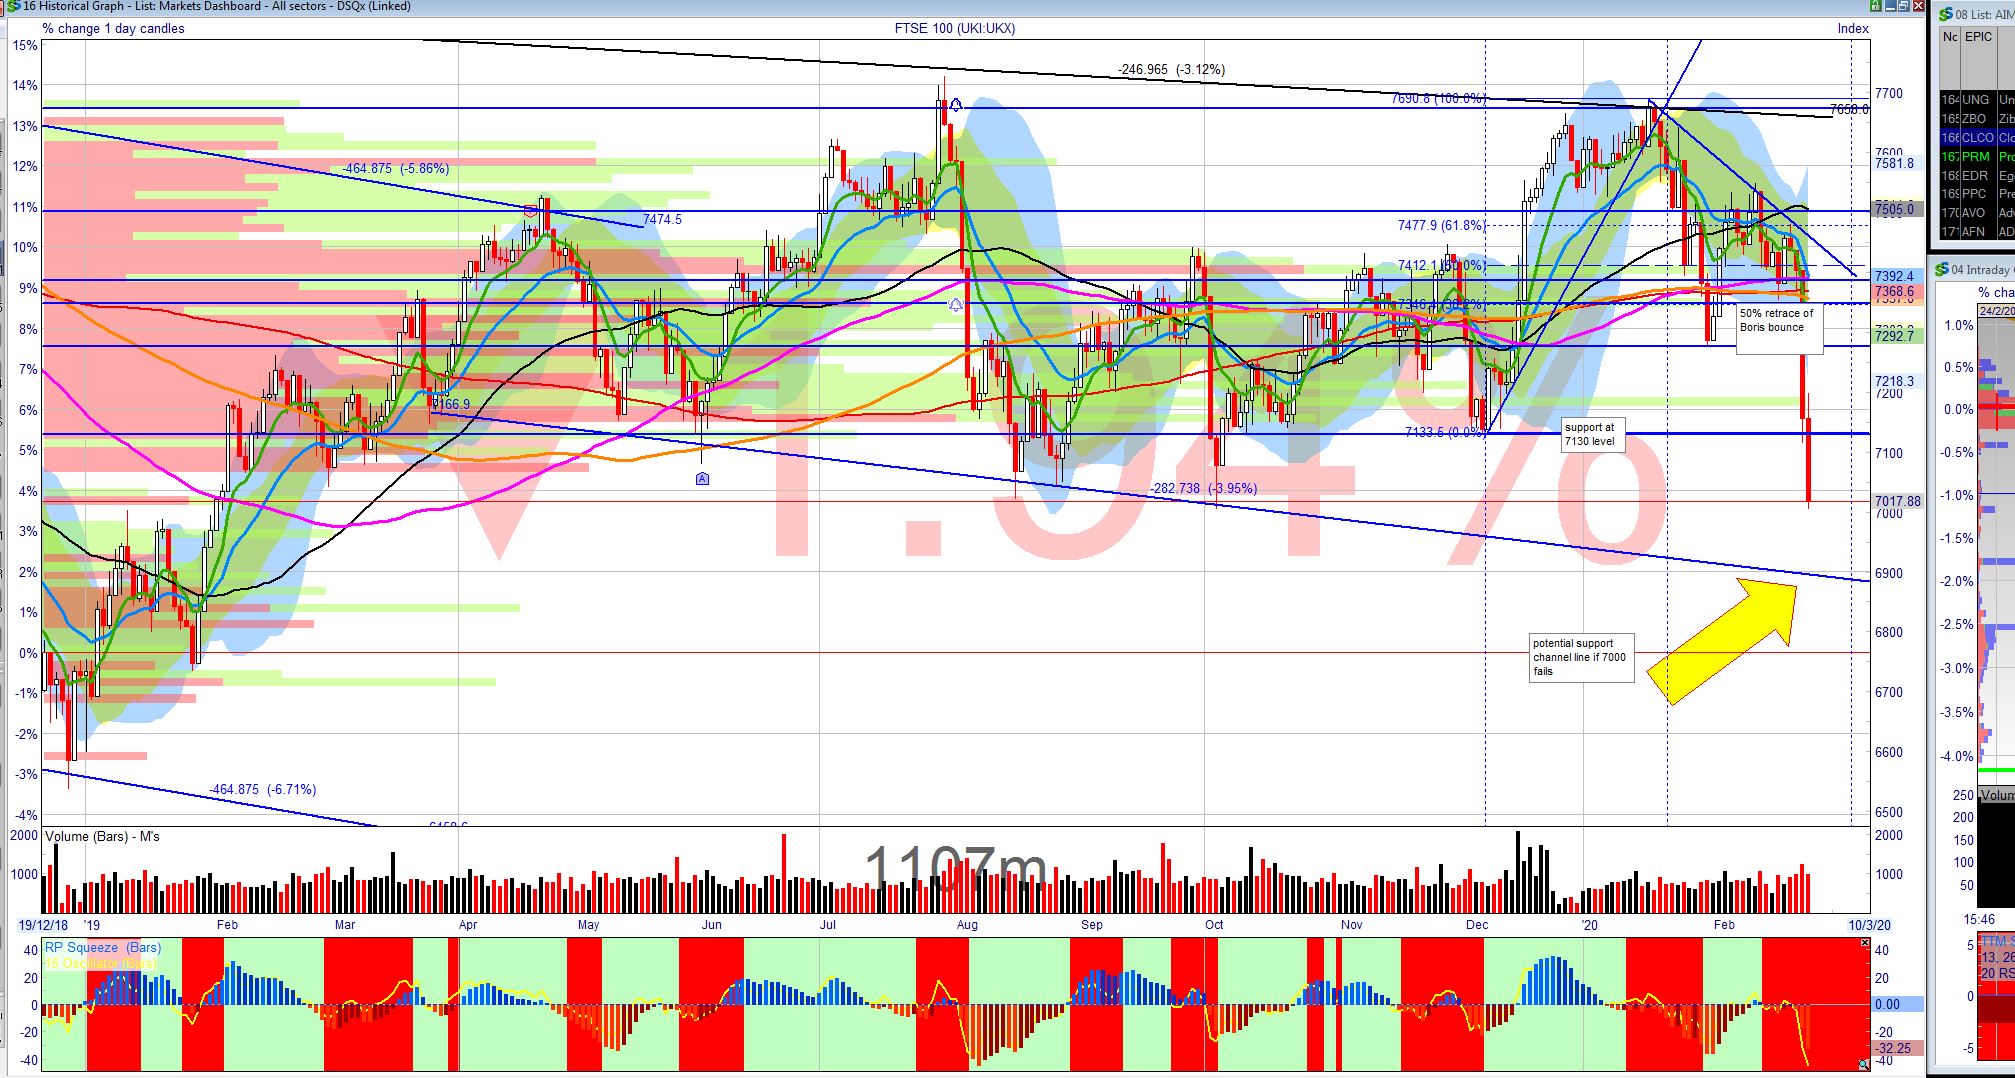
Today saw some glimmer of a relief rally on the open with the major UK indices rallying even as gold was pulling back. The rally in all European indices was short lived and quickly gave way to more selling with the FTSE 100 down another -1.9% today while the midcap 250 was down almost -2%. Today saw some contagion in the selling as even the housebuilders started to sell-off with relative under performance by BDEV, PSN TW, RDW with all Household &Construction name i in the FTSE 250 down over 3%. Selling was pretty broad across sectors although Airlines and Hotels continued to be punished.
Today also saw the FTSE 250 sell-off more than the other indices though this more domestic facing index has been more bullish over the past few months. Impacts of supply chain shortages on UK operations are already becoming clear providing concrete examples of what the China shutdown may start to cost in the longer term. All that being said we again must focus on the recent significant gains in the UK and global markets: while this pullback may seem sudden and savage, it is natural part of any market cycle. It is still far to early to declare black swan sightings although these downward moves will bring perma-bears out of their recent hibernation (if not capitulation). The FTSE 100 has retraced all of its gains from Oct 2019 and is now testing that low around 7000. Big round numbers like these act both as targets and often as buffers when markets are in decline. Watch for volume buying at this level to defend a 6 handle on the FTSE 100 and all the ignominy that brings. If this fails then the likely next stop is a channel line around the 6900 level.
Finding some Green in all this Red.
The RP Scanner uses selected technical to identify the most bullish or bearish shares given a relative strength measure for shares in the universe.
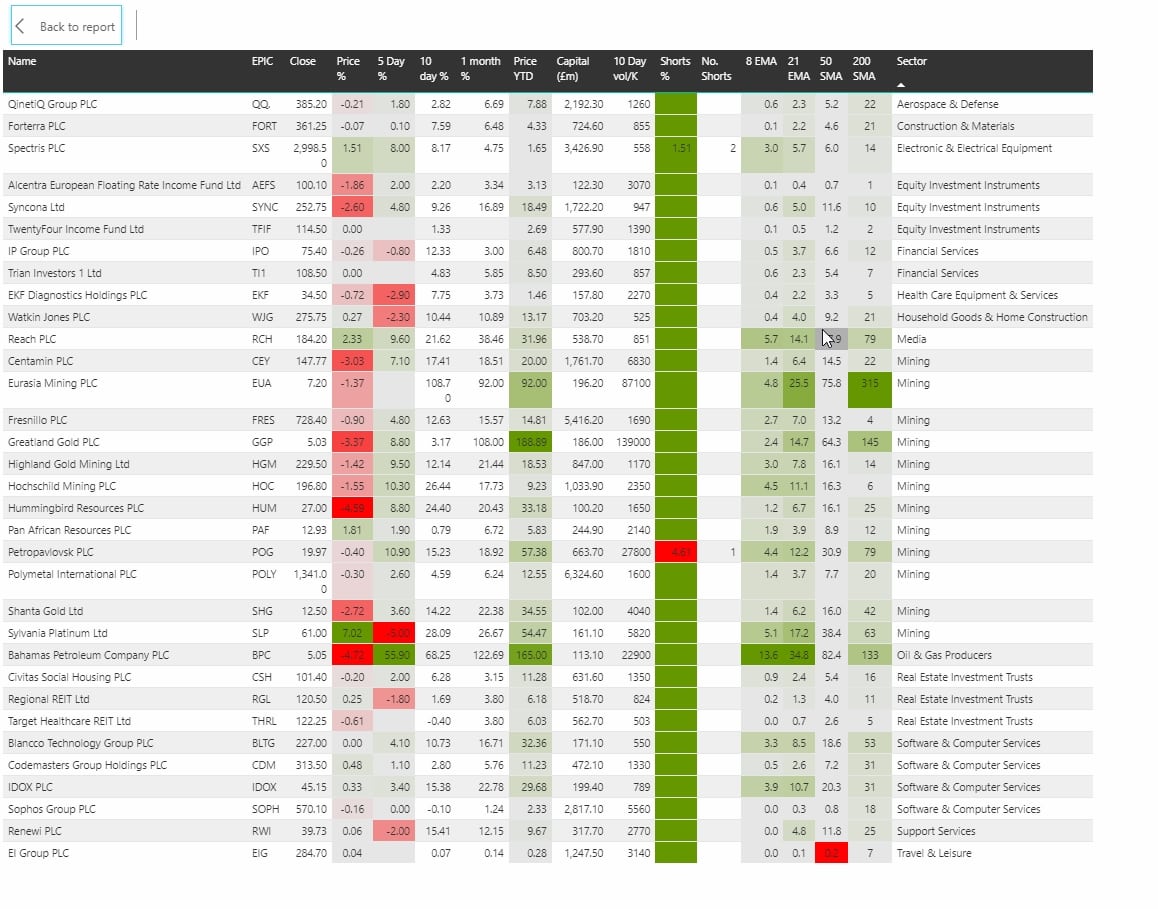
In Section 19 Trade Scanner: using the sliders one can select all those shares than have price above their major moving averages: these can be further fine tuned by Market Cap and Daily volume to whittle down to select number of candidates with good trading qualities (reasonable size, liquidity and spread)
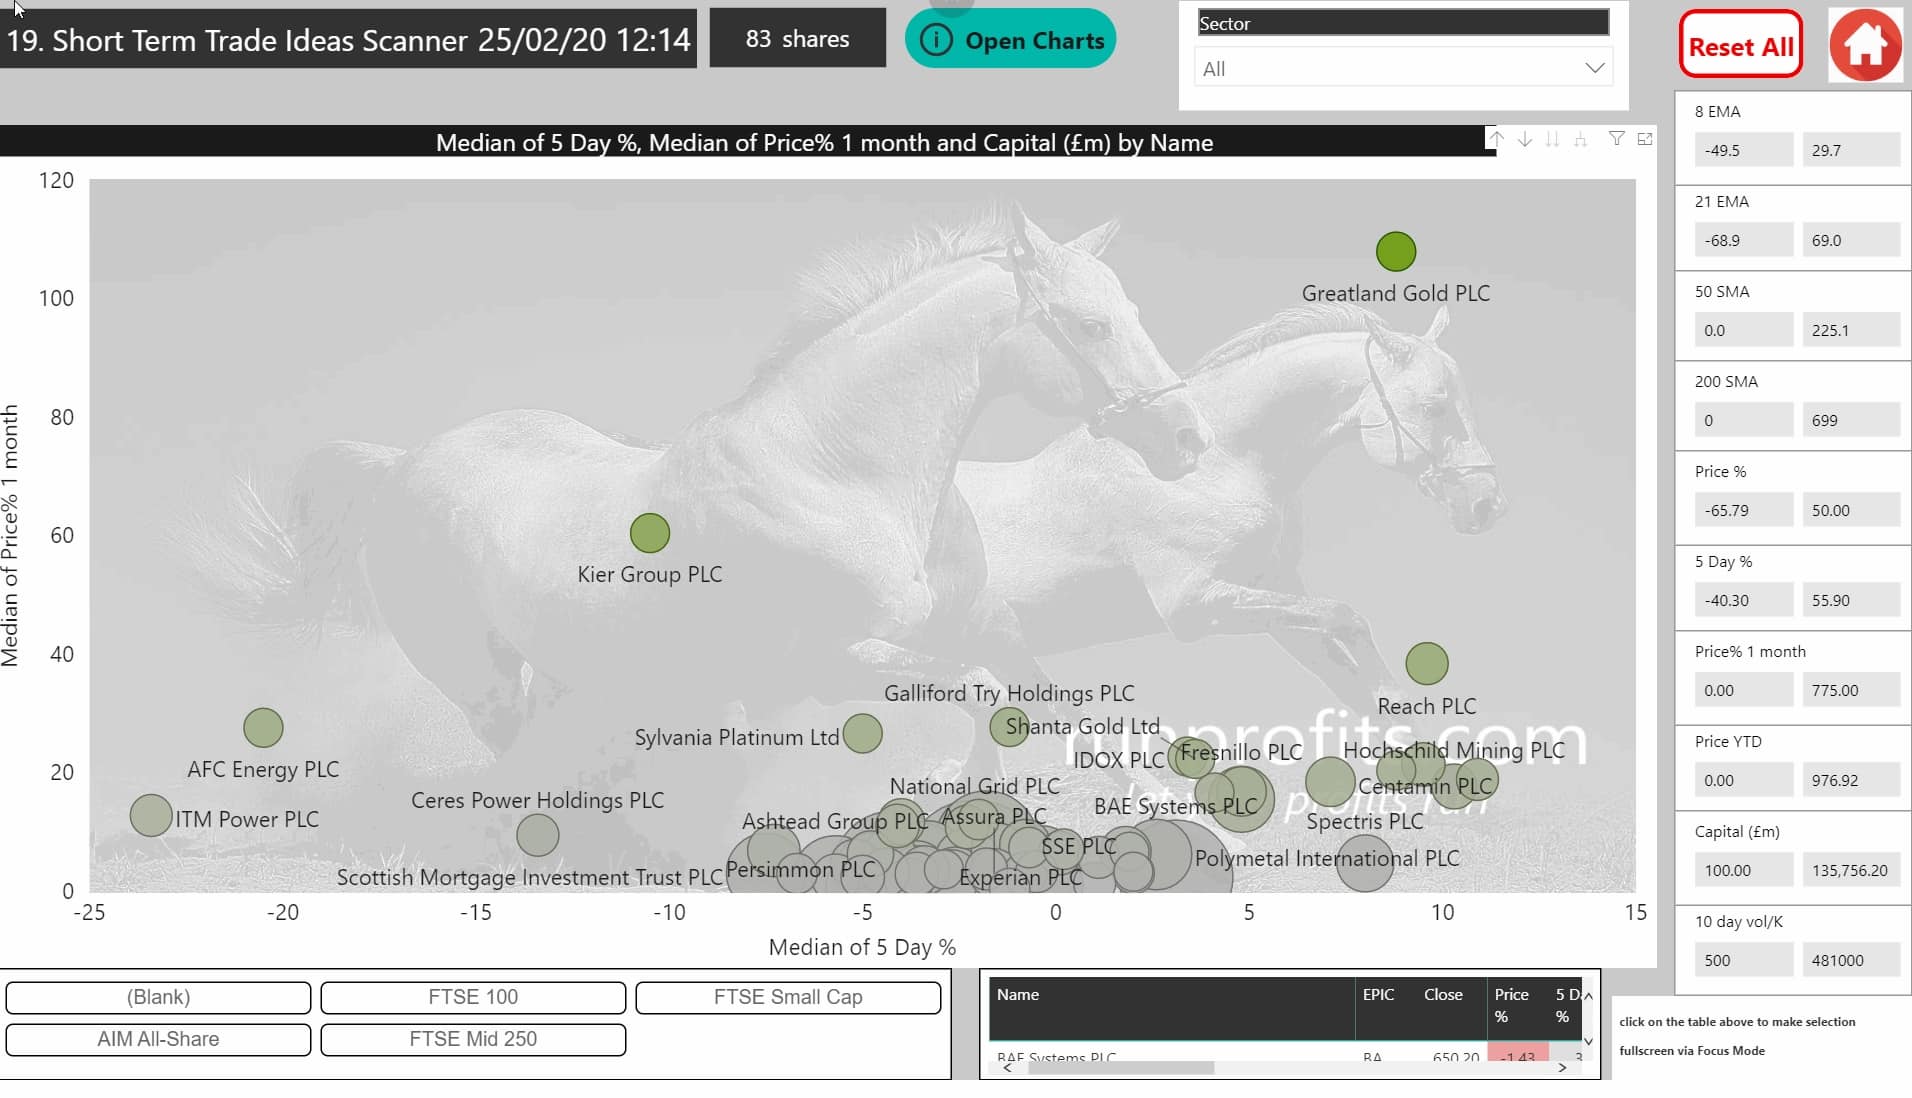
Figure 1 shows a scan from today where only shares with price above ALL moving averages is chosen. Choosing only those with positive price momentum over the past month and YTD and selecting for an MCAP> 100M and daily volume >500K shares returns just 33 shares
And the Winners Are
Out of the 33 shares in Figure 1, 12 are precious metal mining companies rallying with the recent upthrust in gold and related precious metals. While this may well be a short term thing, many of these shares have sufficient liquidiy and tight enough spreads to make some good tactical trades even through spread betting platforms. This keeps execution costs lows and allows for very quick exits should the main indices recover rapidly and the gold trade start to fade.
In time of increased volatility, making smaller tactical longs and even selective and hedging shorts can not only be very profitable but can also prevent idle hands from doing devil's work to good portfolio positions for those with longer term horizons.
Using the right sizing, adopting good risk management and keeping an eye to correlated spot gold and index price is key for success here. That said, gold's spectacular reemergence after years of hibernation seems likely to last so many of these names will also make good portfolio positions in their own right for those with longer term intent ...though some may well pullback when market volatility decays.
The other sector that feature prominently is Software with CDM, BLTG , IDOX and SOPH all holding up well and maintaining positive double digit performance YTD for the first 3.
How to Scan for Pullbacks
There are many ways to scan the database and in fact, scanning for those which are pulling back but not bearish is often a very valid way to get long a strong trend.
In that case,
choose stocks of the right MCAP and volume for your risk appetite
then select those which remain above their 200 and 50 DMAs BUT below their 8 and 21 EMAs.
These are effectively pulling back but remain medium and long term bullish.
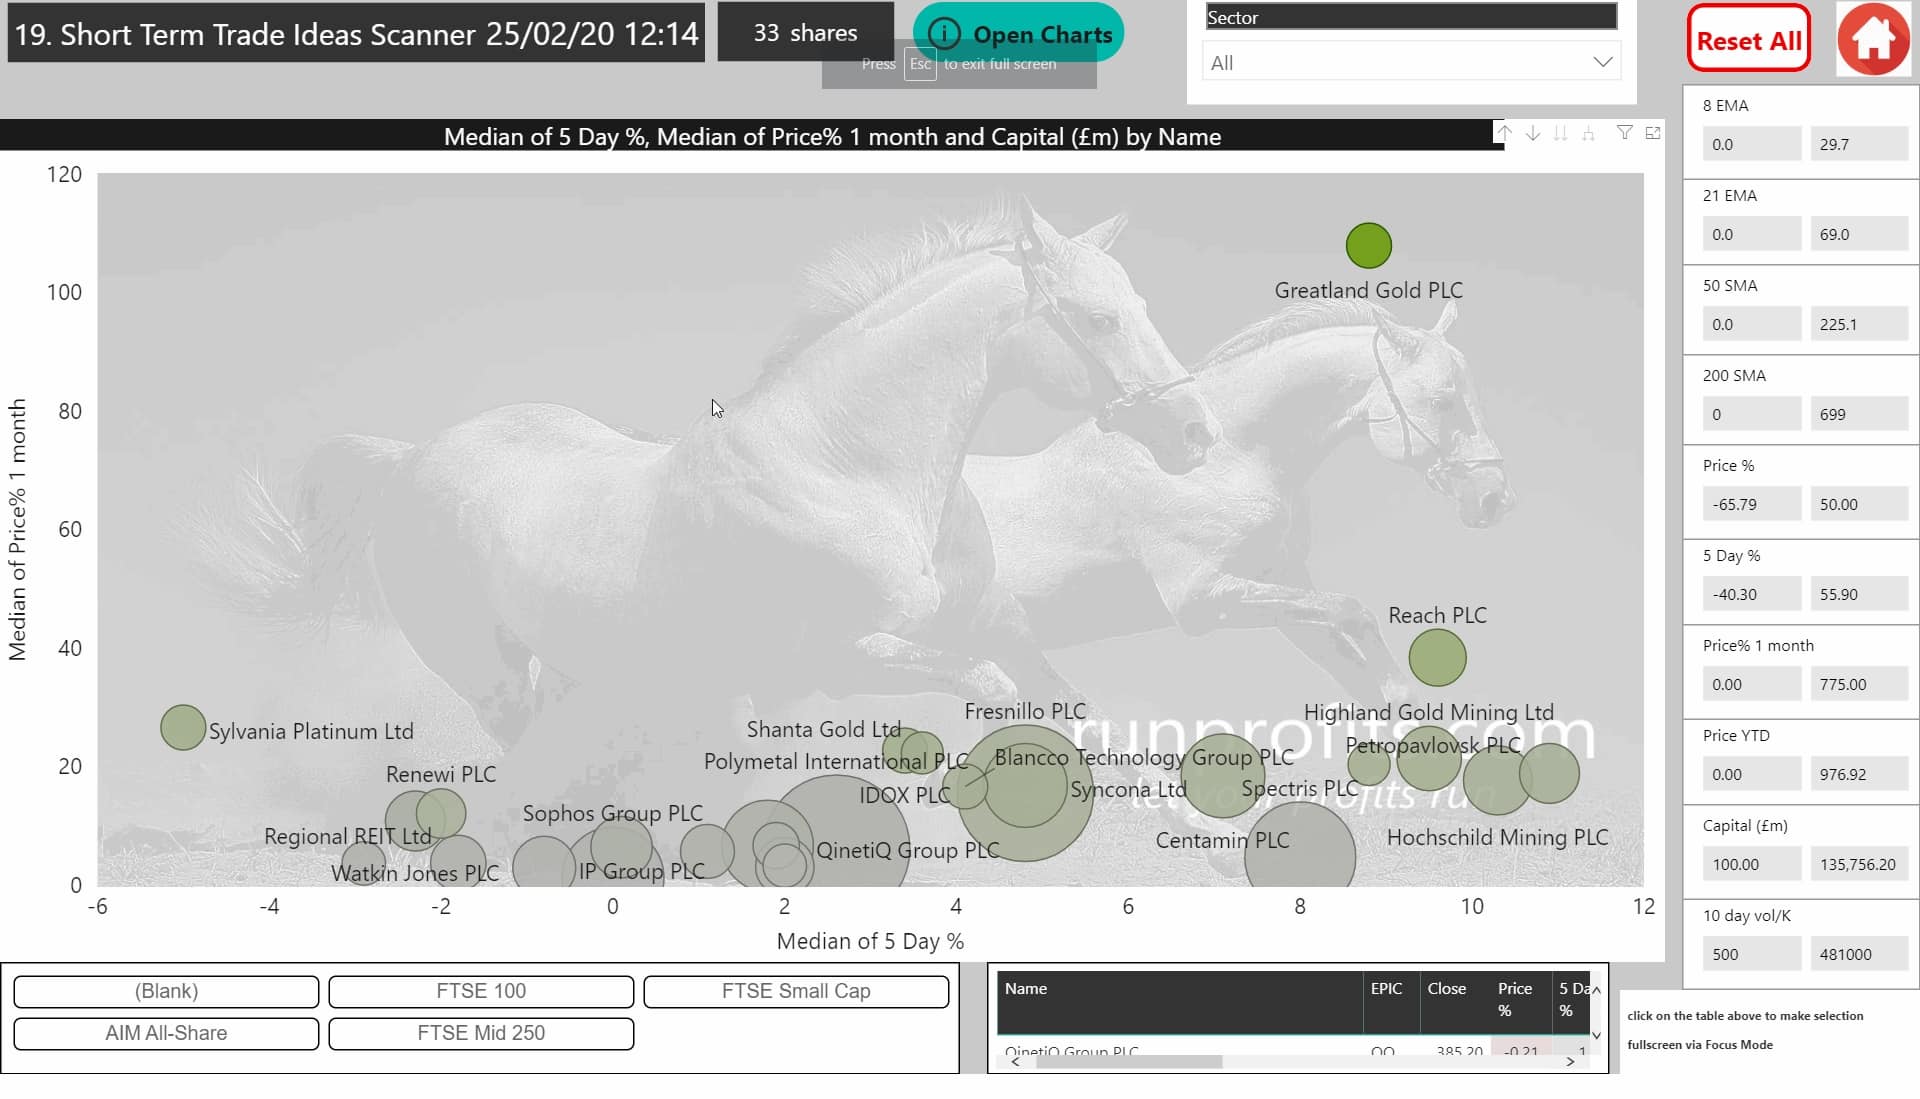
so scan setting >200DMA > 50DMA < 21EMA < 8EMA Price 1 Month > 0 Price YTD > 0 MCAP> 100 Vol > 500-1000
Some chart analysis is then needed to ensure you are not buying stock in decline as opposed to pulling back but a good rule of thumbs is that any stock which pullbacks below its 21 EMA for more than 2 closes is likely to be reversing trend in the medium term.
The above setting currently find just 83 shares from the 1648 universe in Figure 3: note the extraordinarily bullish Alternative Energy names are among these with AFC, ITM etc losing 20-25% over the past couple of days