
Contents: Click on Link to View
Toggle
Please add me to runprofits.com mailing list for future articles and trade ideas
Are we there yet? VIX above 31
Rarely do market sell-off with the ferocity seen today: at one stage the FTSE 100 had sold-off over 4% in one day and has now made the biggest weekly move south since August 2011 when it lost 9.9%. Today’s selling was broad although the worst hit sectors in the FTSE 350 were Life Insurance, Gen Retail, Mining and Transport & Leisure all down between 4 and 7%. The FTSE 250 which had outperformed the other UK indices to date, dropped over 4%. The markets are still trying to discount the effects of COVID-19 and the disruption to travel and supply chains. The big run-up in 2019 left markets toppy which combined with very low risk sentiment to steepen the descent. Pretty much anyone with any long exposure to the markets has lost money this week as almost everything has sold-off. Crude dropped another 6% today although there seems to be a slowing in the sell-off of the mega cap oilers, partly as they are significantly oversold by any definition and the likes of BP and Shell are stalwarts in most pension funds so some buying is to be expected at these heavily discounted values.
Today's selling may well be indicative of some capitulation and a relief rally is much over due. That said, uncertainty is likely to remain high and markets unstable. Throughout this sell-off, copper has remained relatively sanguine and has not made new lows for the year. Neither has gold spiked to the extent one would expect if this sell-off was the prequel for a more sinister down turn.
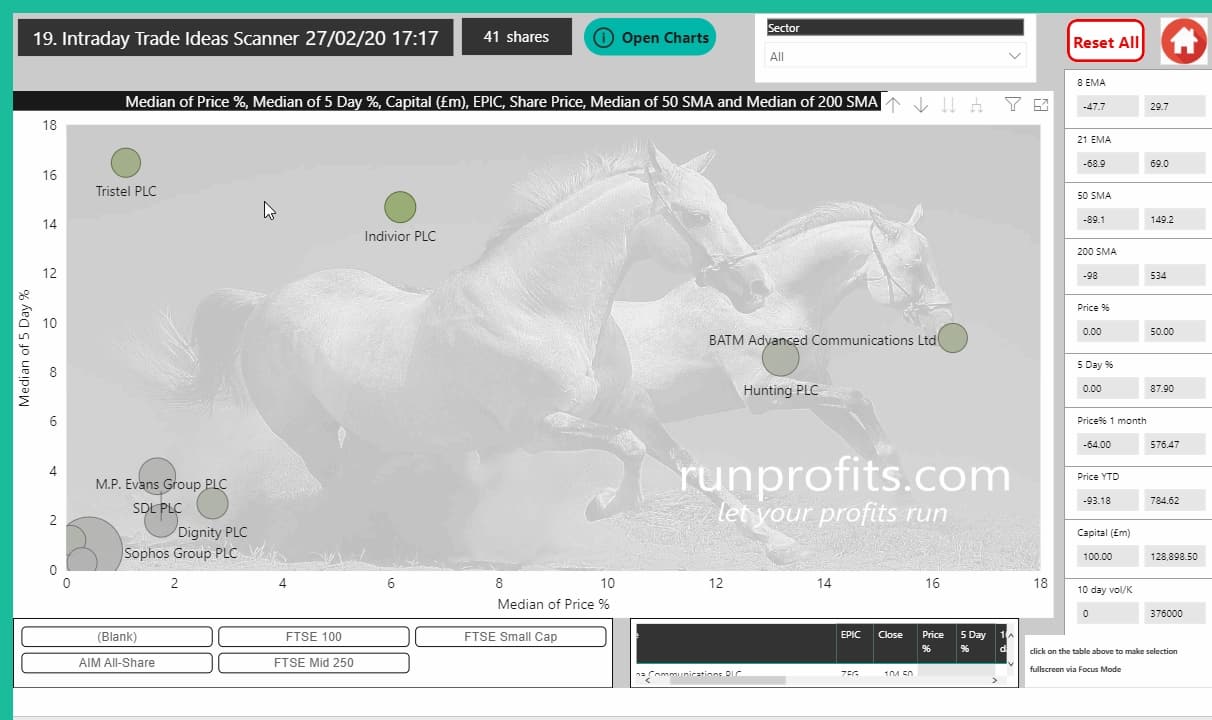
So what is working? In the total UK universe of 1644 stocks, 1131 sold-off and just 134 were in green today : of those just 41 with a market cap above £100m are positive on the week and are shown below: these include TNDV, TSTL, INDV and DTY. Scans for relative strength and weakness can be made using RP Scanner in Section 19 : selecting for shares based on price performance, price relative to moving averages which can be further screened by market capital and daily volume
Selling Broadens and Deepens: FTSE 250 Drops 200MA - 12:00 Update
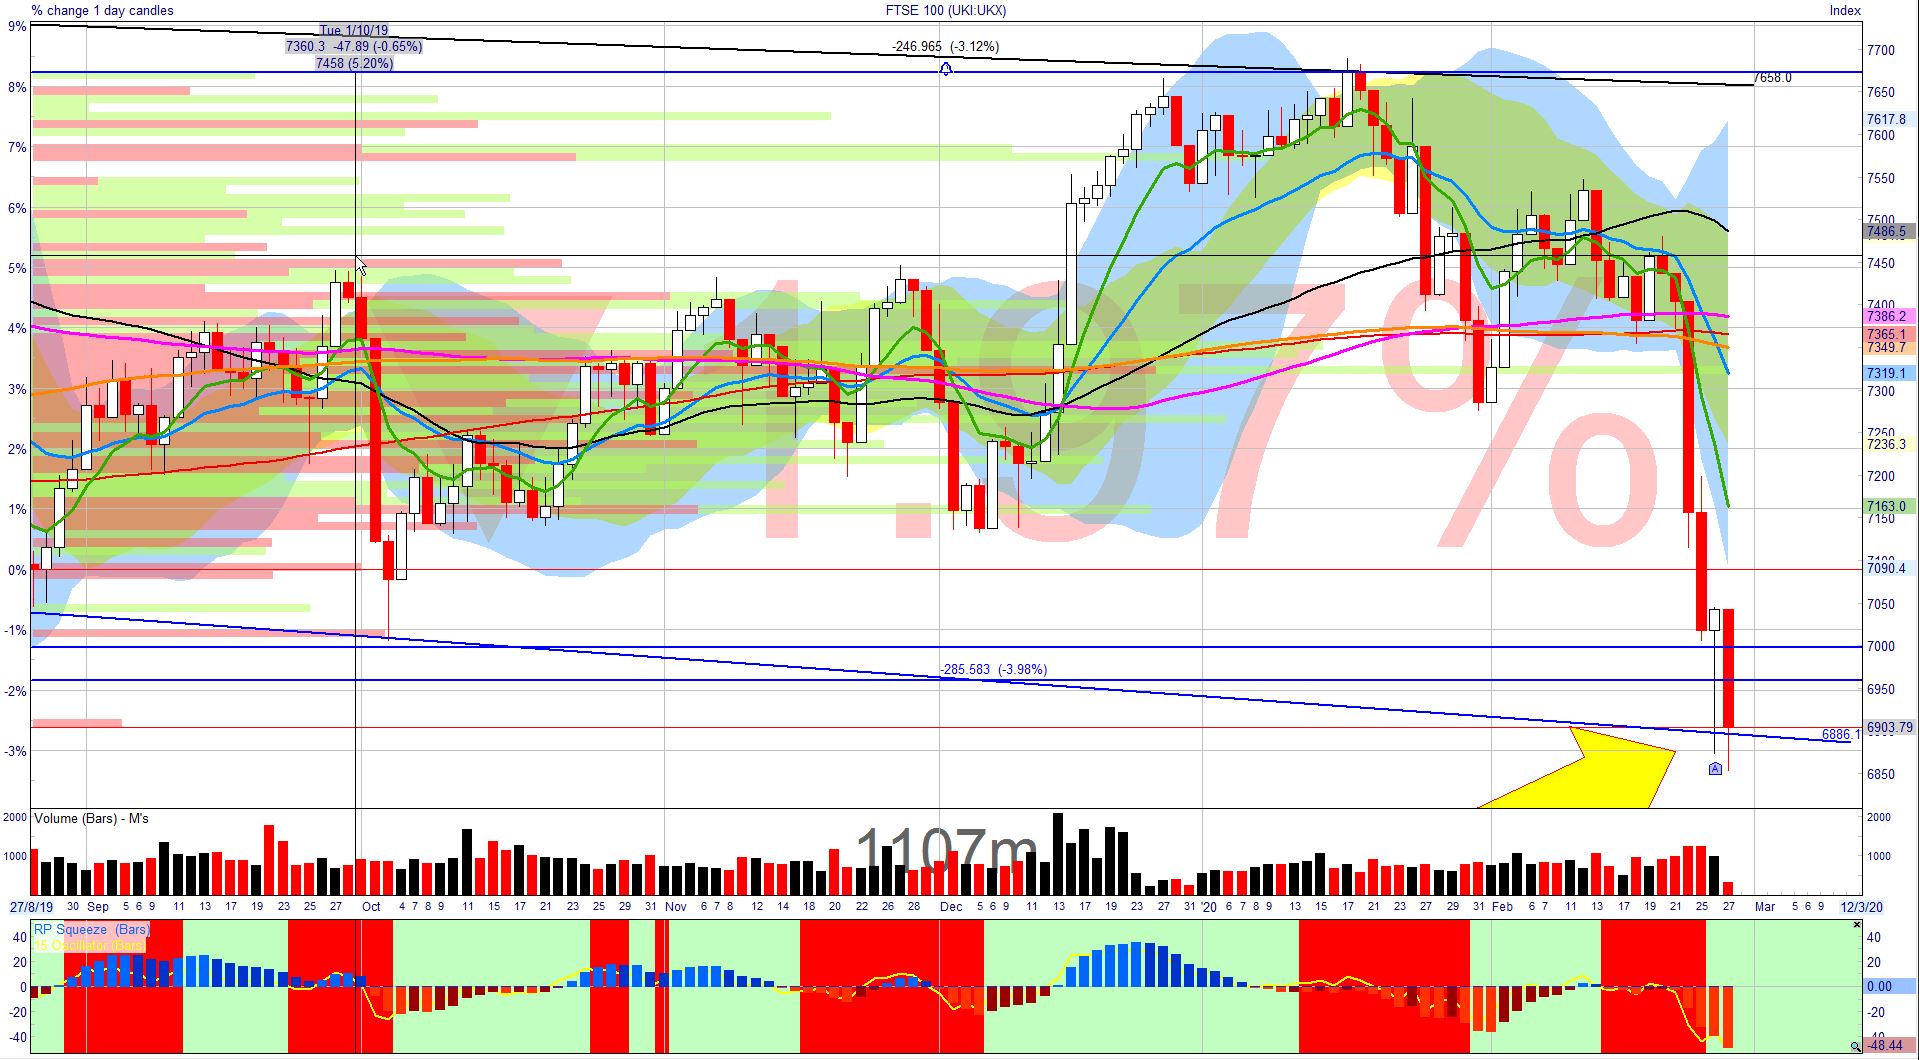
Both the sentiment dashbaord and RP Scanner have been updated for intraday data in these fast moving markets. Equity markets continue to look ugly as almost every sector and share in the UK sells off in a broad selling: of the 1647 universe only 143 are rising while 1054 are falling. The FTSE 100 is valiantly trying to hold the 6900 channel line having made new lows intraday briefly dipping to 6853 before recovering. If the 6900 level yields then a value around 6600-6700 seems likely where the mega cap index found some support in Dec 2018 (when it reached a 6540 low).
Oil gapped down this morning and has dropped almost 5% intraday to $51.6 as the effects of the coronavirus are played on out on travel , air and supply chains which will impact demand.
In truth, everyone is clueless on what the potential implications of Covid-19 might be as the spread and impact on supply chains, operations and mobility are yet unknown. What this does is add huge uncertainty to risk assets which in turn causes many investors to shun these until more is known. Understandably the relative safety of cash and bonds will attract capital until uncertainty has been diminished or at least quantified and qualified.
Next update will take a deeper look at sectors and shares to profile some stars and dogs
Futures Weak suggesting the FTSE Cash may retest lows - 07:20 Update
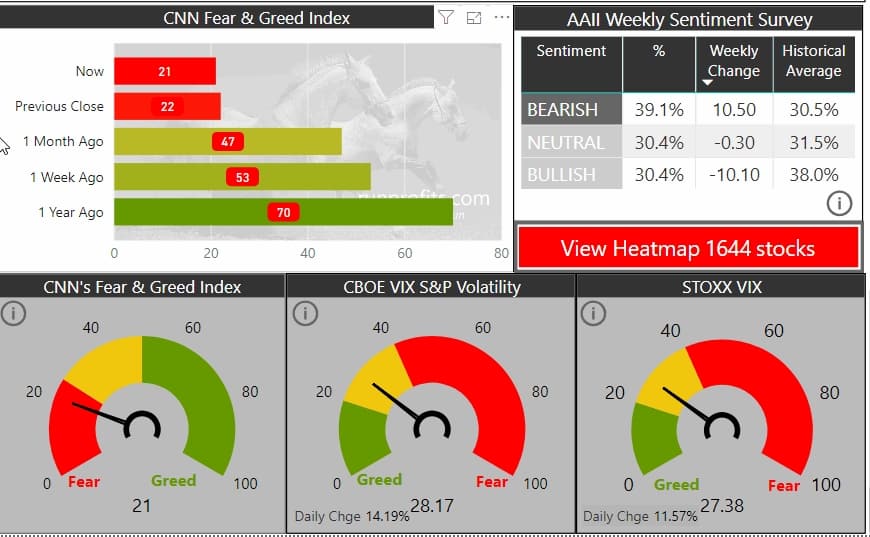
Initial optimism in the US yesterday about the potential impact of the coronavirus faded rapidly as the buy-the-dip norm gave way to sell-the-rip. The initial 1.5% gain turned to red as all the indices sold off with the DOW dropping below its 200 MA for the first time since Oct '19 and forming an ugly inverted hammer on the daily: a very bearish reversal. There is a change in investor behaviour which of late had rewarded buying any weakness. The Fear and Greed Index has dropped to 21 which, while much lower than recent scores, is a far cry off all-out panic which is signaled by single digit figures. Incidentally the F&G score of around 5 was last seen in Dec '18 when the DOW had dropped over 20% from its Oct highs. This may well auger that there is much more selling to come and that a deep correction is on the cards. Alternatively, Trump's attempts to soothe fears and political pressure on the Fed's Powell to intervene may means there is another backstop and investors may hold firm. This is a presidential year on the US these have proven positive for the S&P in 19 of the past 23 election years since 1923.
What is the VIX and Why is it Significant?
In trading and investing one will often hear the term VIX and Fear Index used interchangeably. The VIX is an expected measure of price volatility in the US S&P 500 over the coming 12 months. It is derived from ratio of put (bearish) option volumes to call (bullish) option volumes using their premiums as a measure of risk. So a VIX of 26 implies a potential price variation of the S&P 500 over the coming year of +/- 26% at one standard deviation or 68% (normal distribution confidence curve) : i.e there is a 68% change that price will lie within +/- 26% of the current value over the coming year.
Clearly the higher the VIX the higher the expected risk . While the VIX is often used as a leading indicator, extremes of the VIX are often contrarian indicators. So for example, recent very low VIX values around 10 or even below were signs that little protection was being sought and that traders and investors were extremely complacent. The converse is true, when VIX scores spike higher this reflects high degrees of implied volatility which are unlikely to continue. This does beg the question, what is a "normal" VIX value. That in turn depends on the underlying market volatility. When I first started trading full time in 2010, normal VIX values were around 20 as markets were skittish and investors nervous following the fallout of the GFC: the Figure below shows how VIX was hugely elevated during the financial crisis in 2009 with values up to 80.
In more recent years as global QE has swamped markets, volatility has tailed off particularly with EFT and program buying as passive investing has become more prevalent and investors more sanguine. Recent more "normal" levels of VIX have been below 20 and around 15 with frequent VIX levels of 12.
