Contents: Click on Link to View
Toggle
Please add me to runprofits.com mailing list for future articles and trade ideas
Weekly Wrap: Weak rally in FTSE 100 and FTSE 250 ends on a Low
After this harem-skarem rollercoaster of a week, most market participants will welcome the weekend and time to recoup and reflect After an almost 8% rally at the peak today, the FTSE 100 sold-off but closed positive holding on to 2.5% of the gains. These were concentrated in Mining, Banks , Food and Drug Retail and defensives such as Utilities, Tobacco and Beverages. Oil and Gas having rallied in the morning once more sold-off and finished at new lows as did Travel & Leisure.
The FSTE 250 lost more ground today down -1.3% making a new low for the week and 2020. The AIM All-Share held on to a 0.9% gain
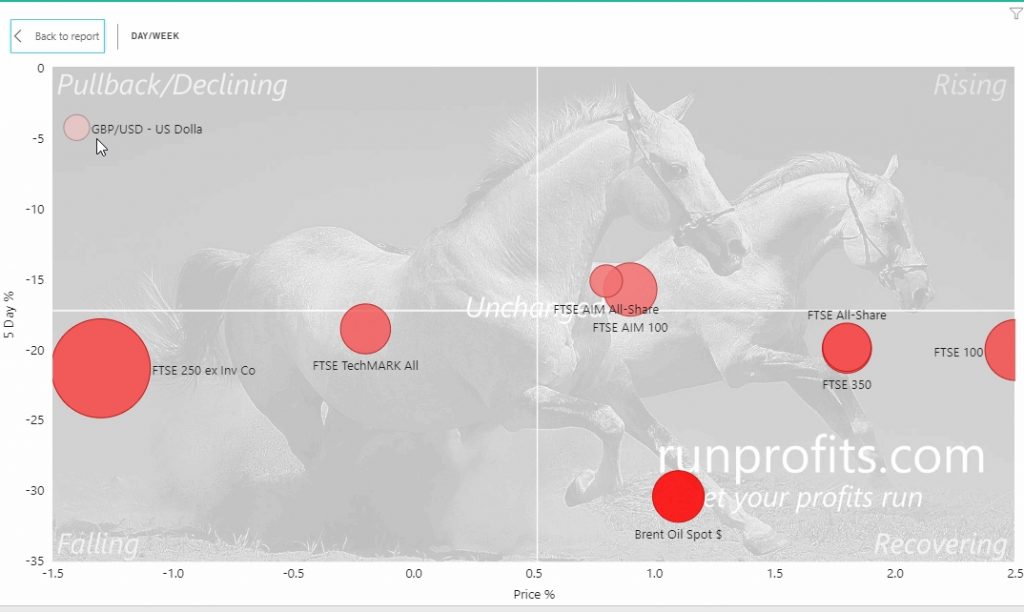
The plots below put the moves in perspective over the past week: all of the indices are down 20% or so on the week which is hugely anomalous

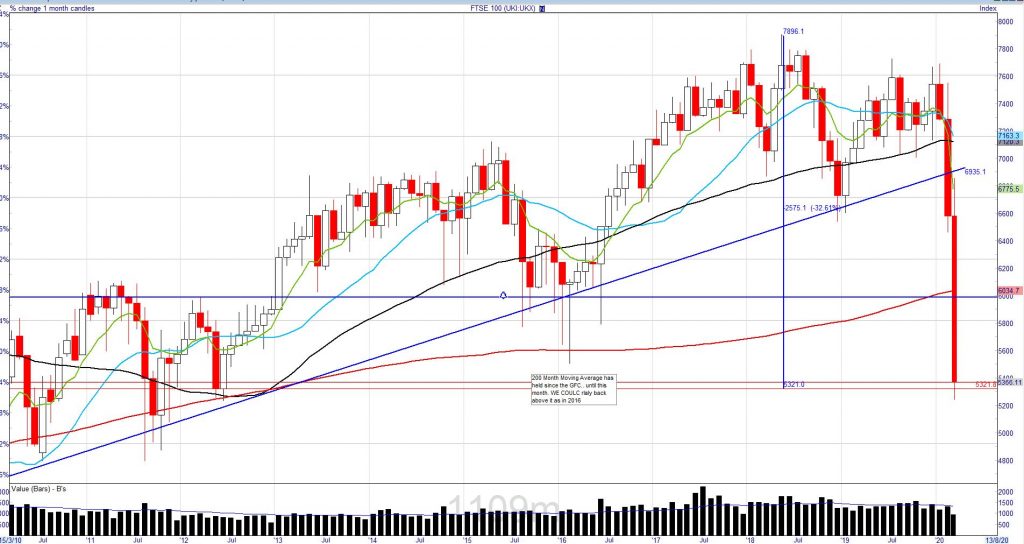
FTSE 100 Loses 200 Month MA: Warning Sign of a Bigger Crash or just Oversold?
After the historic price moves this week there has been no shortage of punditry and histrionic narratives. We tend to deal in data and the monthly plot of the FTSE 100 below is sobering. The FTSE 100 monthly candle has never closed below the 200 month moving average since the GFC. We still have a couple of weeks so we can't rule out a rally but this does look like an ominous warning sign given the backdrop of slowing global economy, a global pandemic and the diminished firepower left with policy holders after a decade of economic triage.

What is Happening to Oil and Gas and Is It a Warning?
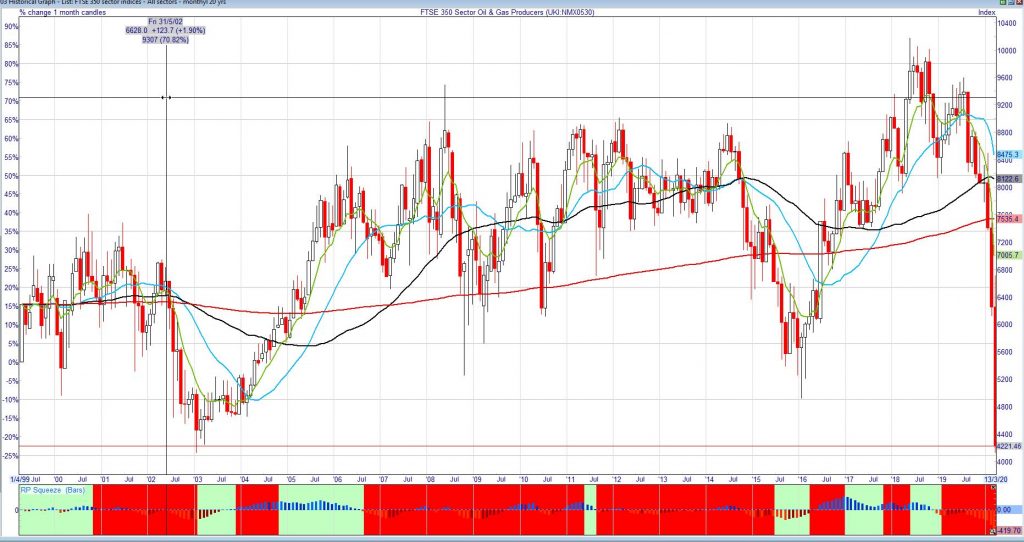
The extent of the sell-off in the Oil & Gas names this week has been astonishing. While crude did crater, it isn’t yet below $30 nor is it as low as the 2016 level when Oil & Gas stocks fared much better. The plot below shows that the FTSE 250 O&G Sector is now at levels last seen in 2003 and a lot lower than during and after the financial crash of 2008
It appears that the sector is telling us something more fundamental: whether as a prelude to much lower oil prices, a leading indicator of economic activity or signalling its own ultimate demise in the face of climate activism and renewables? Given the relatively low contribution of the latter to current global energy output (around 15% though growing) , I’d favour one of the former reasons. The plot below shows the FTSE 350 O&G Producers Sector Chart stretching back to 2001. The sector made a new all time low this week and has fallen 60% since 2018.
When combined with hugely elevated VIX levels and many FTSE 100 stalwarts making decade long or all-time lows, this adds to a growing sense of unease about the health of the market and whether we are entering a new period of the business cycle with an impending deep recession or even another financial crisis. A simpler explanation is we have sold too fast and too far and a recovery is on the cards. If it is the latter it will become clear in the coming few weeks, if the former it may take longer and be much more profound. In the interim we are bound to have an abundance of volatility which will create plenty of trading opportunities.

FTSE Futures Give Cause for Hope: Oil up 9%: 07:30
Commitments by the US Fed and BoJ to buy bonds and ease liquidity may help to steady markets as Asia closed off its lows and the FTSE futures signal a potential green shoot up 3% at pixel. Oil has rallied overnight up over 9% to above $36 which may help embattled Oil & Gas. Given the huge dislocation sin the markets and the widespread selling yesterday, market will remain incredibly unstable and unpredictable so who knows what today will bring. The purpose of wholesale maker intervention is to try and restore some stability and stem the panic selling and enforced selling.
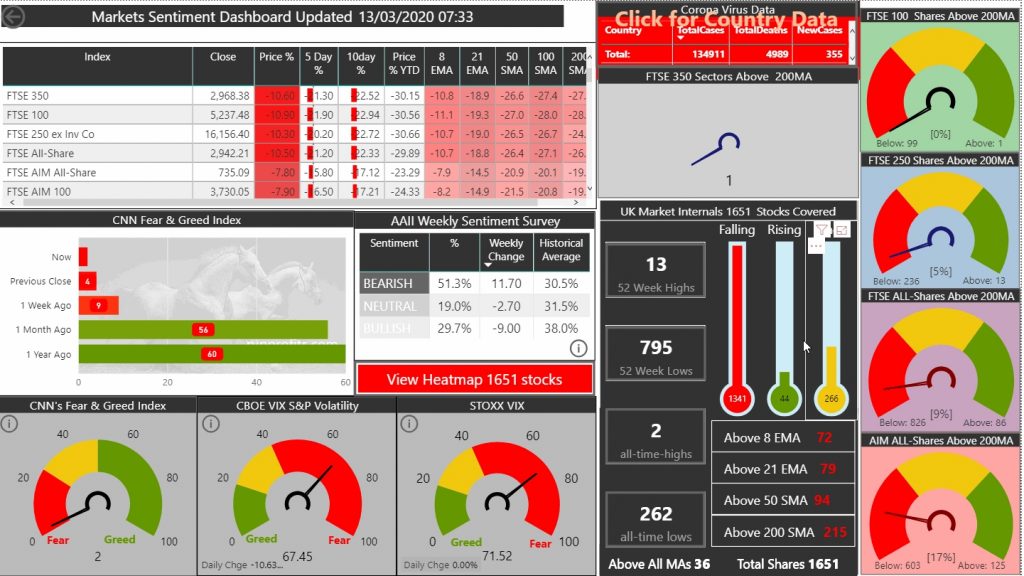
Sentiment is unsurprisingly very low with the Fear & Greed Index almost at its lowest - 2 while VIX is now over 71

