

ACE Week Ahead w/c 15 June 26 : AO. AXS CGS CML CORD DUKE FGP IHC OMG PEEL PZC REC SDY STEM TAM TIG TPX TSCO WSP XPS
WACE Weekly ACE Guide WACE Weekly ACE Guide The WACE (Weekly ACE) dashboard is a semi-quantitative framework designed to sharpen...
Read More

ACE Analysis Fri 12 June 26: MCB MPE PCTN
Early Liquidity FTSE 250 all in Green ACE Price Response FTSE 250 glowing green as the most beaten up play...
Read More

ACE Thurs 11 June 26 : HLMA NCC NXR PAY SAFE SEQI WIZZ
Morning macro Green in the mega and mid caps yesterday while the precious metals took AIM lower and oil popped...
Read More

ACE Wed 10 June 26 : CAML FSTA HPOW TLW Scan IIG ENQ CMCL MOTR PNN FDEV VOD BKS BOOM VP WKP SMWH
Early Liquidity : Price Reaction to ACE Scores FTSA Makes a Break for it SMWH Squeezes South TLW ACE 7.7...
Read More

ACE Analysis Tuesday 9 June 26 BWY LBG OXIG PRTC
Macro Pre Market UK markets finished pretty flat yesterday recovering the early losses especially as the NASDAQ when it reopened...
Read More

ACE Analysis Monday 8 June 26 BOOM GRID KEFI Scan BRCK CORA HEX MWE
Bond Yields Back in Focus as Oil Spikes and DXY Hits 100 We start the week following the US "Tech...
Read More
ACE Week Ahead w/c 8 June 26 :HLMA OXIG BWY WIZZ FSTA SAFE GROW PAY PNN SMWH VP. WKP NXR NCC MOTR SMIF SEQI PCTN VNET LBG HPOW GENI
WACE Weekly ACE Guide WACE Weekly ACE Guide The WACE (Weekly ACE) dashboard is a semi-quantitative framework designed to sharpen...
Read More
ACE Analysis Fri 5 June 26 RPI SHPP SOM
RNS Announcements at 07:05: This is not updated - check time stamp on report
Read More
ACE Thurs 4 June ACE CMCX GCT MTO PMI Scan: SPR GMET HE1 HGT GPE CGT GCP GTLY OBI JLP RMMC SFOR PMI
RNS Announcements at 07:05: This is not updated - check time stamp on report <
Read More

ACE Wed 3 June 26 DSCV DEBS ITM N91 RFX Scan:SSIT EGL VLG BBOX HWDN ENOG RKH BME
RNS Announcements at 07:05: This is not updated - check time stamp on report <
Read More
ACE Analysis Tuesday 2 June 26 BATS GBG GHH SML Scan : HEX NRR WIZZ LIKE CHH BATS SML PAG SDP CHG
RNS Announcements at 07:05: This is not updated - check time stamp on report <
Read More
ACE Week Ahead w/c 1 June 26:BATS BYG CER CGT CMCX DSCV GBG GHH LPA MTO N91 NRR OBI PAG PMI PNN SRE WKP
WACE Weekly ACE Guide WACE Weekly ACE Guide The WACE (Weekly ACE) dashboard is a semi-quantitative framework designed to sharpen...
Read More
ACE Analysis Monday 1 June 26 APN CER IES PAF : ScanEZJ RCN ENSI SRE DRX JFJ MEGP
RNS Announcements at 07:05: This is not updated - check time stamp on report
Read More
Reporting Fri 29 May 26 : BOR OCDO PIN SRB: Scan AZN SRB EOT SWC OCDO DRX PLSR GPE CHI LDG PIN BOR CPH2
RNS Announcements at 07:05: This is not updated - check time stamp on report
Read More
ACE Thurs 28 May 26 DPP GRX IQE JMAT SSE VSVS Scan: PPH DPP PLSR GRX JMAT HVPE IQE MAJE VSVS TPFG CCC ULTP SSE
RNS Announcements at 07:05: This is not updated - check time stamp on report
Read More
ACE Wed 27 May 26 AXL, BOWL, BOY, CHRT, GNC,: SCAN: GRID ZTF AAU ATM SMT HICL APTD BPM LIV WJG
RNS Announcements at 07:05: This is not updated - check time stamp on report
Read More
ACE Analysis Tuesday 26 May AAZ ATYM DXRX KGF MWE: Scanned AXL CLX CORA CVSG HEX JAR SEI SRP ATYM GAL
RNS Announcements at 07:05: This is not updated - check time stamp on report
Read More
ACE Week Ahead w/c 26 May 26 : ATYM BEM BOWL BPM CLX DXRX FRMI GNC HICL HVPE IQE JMAT KGF NOG OSEC PETS PEYS SSE WJG ZTF
WACE Weekly ACE Guide WACE Weekly ACE Guide The WACE (Weekly ACE) dashboard is a semi-quantitative framework designed to sharpen...
Read More
ACE Analysis Fri 22 May 26 GRID HLCL SCT MTL
RNS Announcements at 07:05: This is not updated - check time stamp on report
Read More
ACE Thurs 21 May 26 : ACE Analytics: SBRE SEA HILS ZIG Scanned: T BMS BT BTG CBG CNE CTEC EZJ FDM GCP HILS HUW IBST ICG IES IKA INVP LMP MAB MBH MTLN NBS NIOX QQ. SAV SBRE SDI SEA SFT SGE SMIN SOI TATE TRU TUN VUL YNGA ZIG and ZPHR.
RNS Announcements at 07:05: This is not updated - check time stamp on report
Read More
ACE Wed 20 May 26 : Analysed : ESNT EXPN IDHC IHP PTEC Scanned: AV. BLND, BMY, COA, ECO, ENOG, ESNT (x2), EXPN, FOUR, HEX, HOME, IDHC, IHP, IPX, ITH, KGH, KLR, MAB1, MKA, MKS, PTEC, RS1, SAG, SCP, SML, SRAD, SUS, and SVT.
RNS Announcements at 07:05: This is not updated - check time stamp on report
Read More
ACE Analysis Tuesday 19 May ACE CURY DOCS DIP FRES :Scan CLDN CCR DSCV EKF HFG IGG JSE RNWH SSPG STS THX TPT VIC BGEO STAN AVCT WATR FRES CURY DOCS DPLM
RNS Announcements at 07:05: This is not updated - check time stamp on report
Read More
ACE Analysis Monday 18 May 26 : CPI HWG KNOS
RNS Announcements at 07:05: This is not updated - check time stamp on report Summaries and Chart Views
Read More
ACE Week Ahead w/c 18 May 26 : BYG KNOS HWG DPLM DCC CWK CLDN SSPG CURY CORD CCR AVCT VIC DOCS EMVC TPT JSE IXI ITRK EXPN KLR SUS ENOG BMY RS1 BLND IHP MKS IPX RGL COA CSC CTA LORD GEMD SMIN SGE YNGA INVP TATE AJB AUTO QQ. EZJ GPE MAB BMS BT.A CTEC LMP SBRE NIOX HDD HLCL BEM
WACE Weekly ACE Guide WACE Weekly ACE Guide The WACE (Weekly ACE) dashboard is a semi-quantitative framework designed to sharpen...
Read More
ACE Analysis Fri 15 May 26 : GFTU GLV UTG VLE Scanned: FRP SEI TIN GRID GAL LDG CNA TTG BGEU
RNS Announcements at 07:05: This is not updated - check time stamp on report
Read More
ACE Thurs 14 May : ATG AV BRBY GATC III PRN THS WOSG Scanned ACG, ATG, AV., AZN, BRBY., COST, ECEL, GATC, GPE, GRI, GRX, HLCL, III, ITV, LAND, NG., PFD, PNS, PRN, SAAS, SHAW, SHC, SPI, STB, THS and WOSG.
RNS Announcements at 07:05: This is not updated - check time stamp on report
Read More
ACE Wed 13 May 26 : AMRQ AVON BAB GETB Scanned: GAMA SPEC AMRQ AVON AXL OMI RSG THX CRE GETB SVS BAB KRM SCF LWI NWG PPHC SPX MSLH VTU ENW
RNS Announcements at 07:05: This is not updated - check time stamp on report
Read More
ACE Analysis Tuesday 12 May 26 : ACE Analytics : 3IN CCT FDEV IMB IMI NWF VOD WIZZ Scanned : 3IN, ANG, AVG, BYIT, CCT, DLN, FDEV, GFM, GRG, IBT, IES, IMB, IMI, IWG, KMK, LMP, MACF, MARS, MIDW, NWF, NXR, OTB, PHAR, RNWH, RST, SEE, SML, VOD, WIX, and WIZZ.
RNS Announcements at 07:05: This is not updated - check time stamp on report
Read More
ACE Analysis Monday 11 May 26 CPG CMCL VCT Scan: 80M LSC AURR JNM ASC TRIG ABDX RNWH UTG BUR EEE VCT
RNS Announcements at 07:05: This is not updated - check time stamp on report
Read More
ACE Week Ahead w/c 11 May 26 : 3IN AMRQ ANG ATG AV AVON BRBY BYIT CMCL CPG CRE DLN FUTR GFTU GRG GRI III IMB IMI ITV LAND MARS NG OTB PFD PPHC PRN RNWH RST SAAS SHAW SPX TCAP TET UTG VCT VOD VSVS VTU WOSG
What is the Matrix? How to Read the Risk Asymmetry Matrix The Risk Asymmetry Matrix is a forensic topographical map...
Read More
ACE Analysis Fri 8 MAY 26 AAF IAG PTSB WPM: Scanned PTSB ITRK CFX BSRT AXL SRT EGY GTE PDL GMS
ACE Analytics Run with an older version of the ACE model owing to Google AI Model availability issues overnight -...
Read More
ACE Thurs 7 May 26: ACE Analytics CCH HBR HTWS PTAL : Scanned HBR PTAL MTLN HTWS MHA IHG CCH BEGO POLN MGAM ICGC BBY SUP ROSE MNG KETL FLTR ICGT NFG JD
RNS Announcements at 07:05: This is not updated - check time stamp on report
Read More
ACE Wed 6 May : ACE Analytics NXT RFX SEE TRN Scan: RFS SEE VANQ TRN ZIOC SNWS NXT JLP AVCT BBSN TBCG SN GMET HSW RSW RCH DGE JDW
RNS Announcements at 07:05: This is not updated - check time stamp on report
Read More
ACE Analysis Tuesday 5 May : ACE CAM HSBA IDOX PLUS Scan: EEE ATM COBR GAL NEWS KOD KOS WIZZ GMS BDCP CNE AMGO CREO RWS EGY
Despite good results ( a slight miss on profits and EPS) and outlook, HSBC sinks -5.8% following the same path...
Read More
ACE Week Ahead w/c 5 May 26 : AAF AV BBY BGEO CCH DGE FERG GTE HBR HCT HSBA HSX IAG IHG IWG JD KOS MGNS HSBA SHEL NXT RSW SFOR SHEL TBCG TKO TRN WPN
What is the Matrix? How to Read the Risk Asymmetry Matrix The Risk Asymmetry Matrix is a forensic topographical map...
Read More
ACE Analysis Tuesday 28 April 2026: BARC GGP LIKE TLW : Scan SRB ELCO CGEO LSA HWDN BP TEP CAN TPK TW POLB WPP EMAN
RNS Announcements at 07:05: This is not updated - check time stamp on report
Read More
ACE Analysis Monday 27 April 26: BGO CTG PWR
NO ACE ANALYTICS TODAY Summaries and Chart Views RNS Announcements at 07:05: This is not updated - check time stamp...
Read More
ACE Week Ahead w/c 27 April 26 : 63 Names AAL AZN BP BARC ELM GLEN GSK HFD HWDN LLOY STAN TW TLW NWG PSN ULVR ROR WTB
What is the Matrix? How to Read the Risk Asymmetry Matrix The Risk Asymmetry Matrix is a forensic topographical map...
Read More
ACE Analysis Tuesday 21 April 2026:BLND GRID IHP RIO
RNS Announcements at 07:05: This is not updated - check time stamp on report
Read More
ACE Analysis Monday 20 April 26: ATG ELIX KNOS PLUS RSW
RNS Announcements at 07:05: This is not updated - check time stamp on report
Read More
ACE Week Ahead w/c 20 April 26 ABF AJB ASC ATG ABDN CER BYG HIK EMG FNTL HOC HIK PSN REL RWS SAA SBRY SMWH SGRO TENG
What is the Matrix? How to Read the Risk Asymmetry Matrix The Risk Asymmetry Matrix is a forensic topographical map...
Read More
ACE Analysis Tuesday 14 April 2026: ACQ BP ITRK OXIG
RNS Announcements at 07:05: This is not updated - check time stamp on report
Read More
ACE Analysis Monday 13 April 26 GPM SRE WISE
RNS Announcements at 07:05: This is not updated - check time stamp on report
Read More
ACE Week Ahead w/c 13 April 26 ANTO ASHM BTRW DGI9 ENT EZJ HAS HTG HVO IMB OXIG RNK TSCO RIO RTO SAGA SRE
What is the Matrix? How to Read the Risk Asymmetry Matrix The Risk Asymmetry Matrix is a forensic topographical map...
Read More
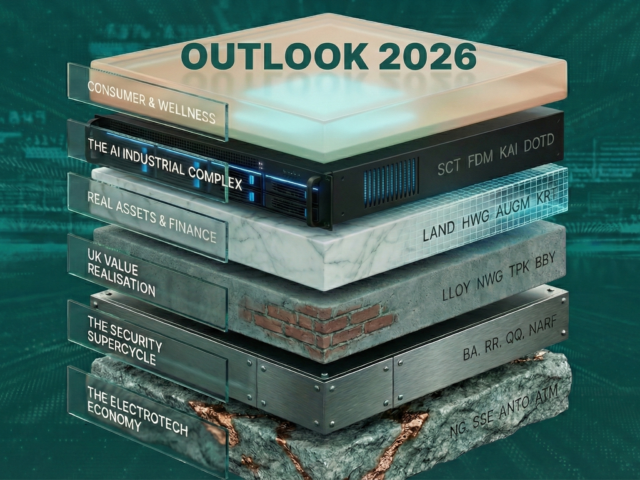
Beyond the Gold Rush: Constructing Your 2026 Alpha Matrix
2026 Macro-Strategic Outlook: Institutional Synthesis and UK Equity Empirical Analysis 1. Executive Summary: The Interpretation Game The global economic landscape...
Read More

2025 Lookback: A Goldmine for the Stockpicker
Introduction: Picking our Way through 2025 - a Tale of Divergence To the casual observer, 2025 was an exceptional year...
Read More

Institutional Global Macro Outlooks 2025
Below are the summary pages and links to the 2025 global macro outlook reports from the world's biggest financial institutions....
Read More

RP Bull Score
How to Use the Bull Score: A Simple Guide One of the most powerful and unique tools you'll find on...
Read More

AI Power Dilemma Infographic One Pager 30 July 25
Currently not signing up subscribers : CLICK HERE if you want an invite for when we are Currently not signing...
Read More

The Probabilistic Nature of Trading Setups
The Anatomy of a Trade: Setup vs. Trigger A trade's success hinges on two core components:...
Read More

High Probability Trade Set-ups an Overview of What Works
High-Probability Trading Strategies: A Detailed Analysis This report examines various trading strategies and setups, evaluating their probabilities of success based...
Read More

Counter Trend Trades are Popular Ways to Lose Money – But IF you Must Use a Setup
Countertrend Reversal Trading Strategy: A Statistical and Practical Analysis Strategy Framework Core Parameters Technical Indicators RSI Divergence: Identify overbought (>70)/oversold...
Read More

Reflexivity in Financial Markets: Themes, Memes, Social Schemes
Understanding Reflexivity in Trading: Examples, Use Cases, and Insights Reflexivity in trading is a fascinating concept that describes the feedback...
Read More

Changes to Short Selling Disclosures in 2025
Changes to Short Selling Disclosures in 2025 The U.K. Short Selling Regulations 2025 (SSR 2025) The U.K. Short Selling Regulations...
Read More

Investing in UK REITs: Navigating the Evolving Landscape
Investing in UK REITs: Navigating the Evolving Landscape January 2025 Prepared for: [Client Name/Organization] Prepared by: Gemini Advanced Table of...
Read More

RNS Results Speak Decoded
The Language of UK RNS Releases: Decoding Market Impact Summary This report analyzes the language used in UK Regulatory...
Read More
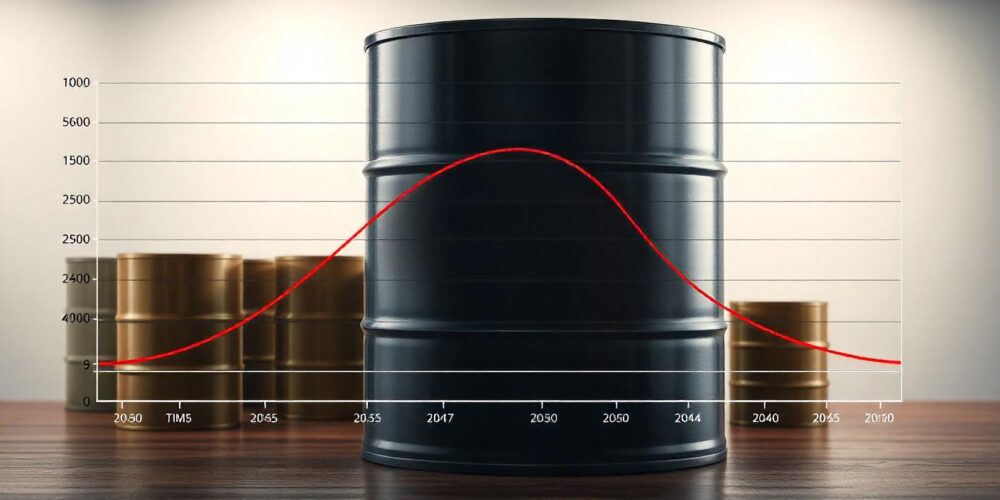
Backwardation and Contango in Futures Contracts
Backwardation and Contango: Unraveling the Term Structure of Commodity Futures Markets In the world of commodity trading, understanding the dynamics...
Read More
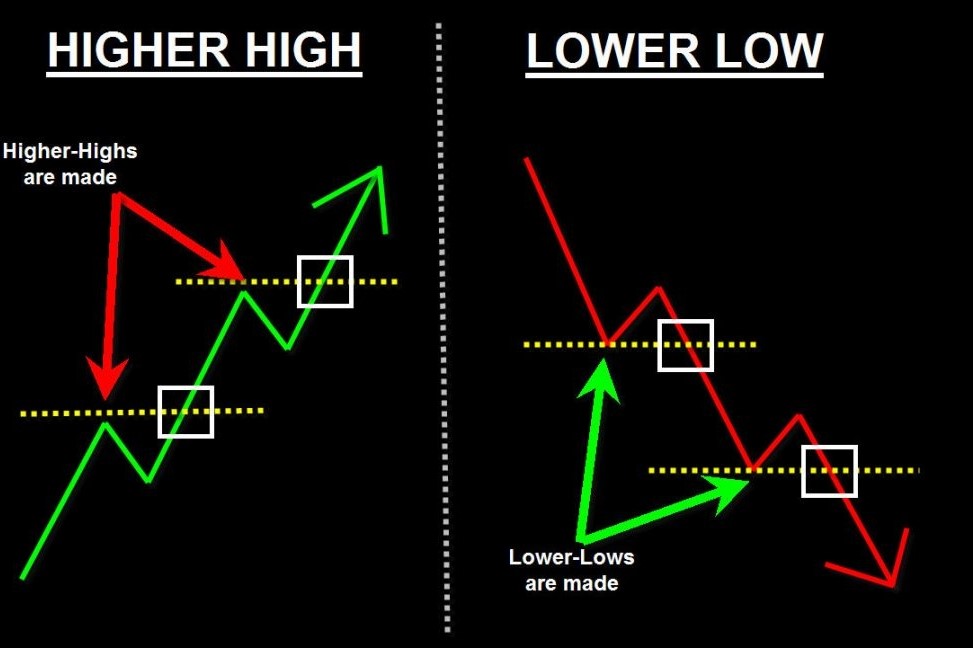
Higher Highs or Lower Lows?
1. Higher Highs and Higher Lows: Foundations of Trading Understanding price trends is essential for anyone entering the trading world....
Read More

Fiscal De-Anchoring
Bond yields can rise due to three main factors: 1. Higher expected real growth rates: When the economy is expected...
Read More
Institutional Global Macro Outlooks 2025
Below are the summary pages and links to the 2025 global macro outlook reports from the world's biggest financial institutions....
Read More