

Figure 1. Major Global Indices Price Performance 2019
[stock_market_widget type="card" template="basic3" color="blue" assets="SYME.L" api="yf" style="font-size: 14; width: 1200px; margin-left: auto; margin-right: auto; background-color: white;" ]
[stock_market_widget type="table-quotes" template="basic" color="default" assets="SYME.L" fields="price,change_abs,change_pct,market_cap,open,high,low,50_day_average,200_day_average,last_update, " style="font-size: 14; width: 1200px; margin-left: auto; margin-right: auto" display_header="true" display_chart="false" pagination="true" rows_per_page="5" sort_field="logo_name_link" sort_direction="asc" api="yf"]
[stock_market_widget type="chart" template="basic" color="red" assets="SYME.L" range="1mo" interval="15m" axes="true" cursor="true" api="yf" style="width: 1200px; height: 600px; background-color: white;" class="align center"]
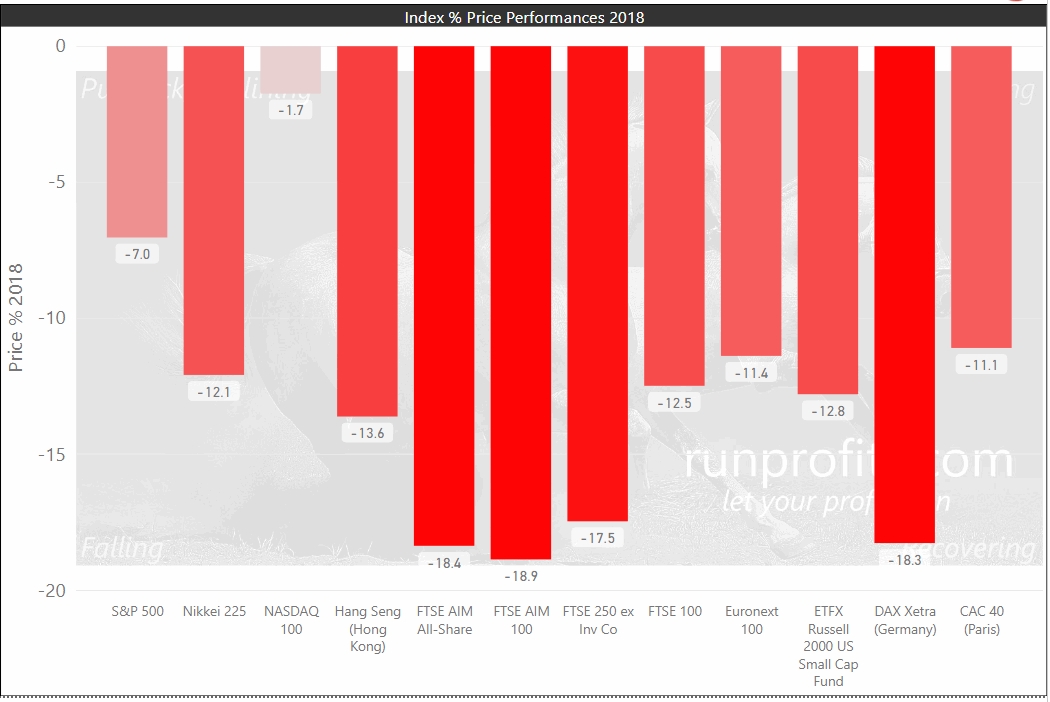
Figure 2 a. World Index Performances 2018
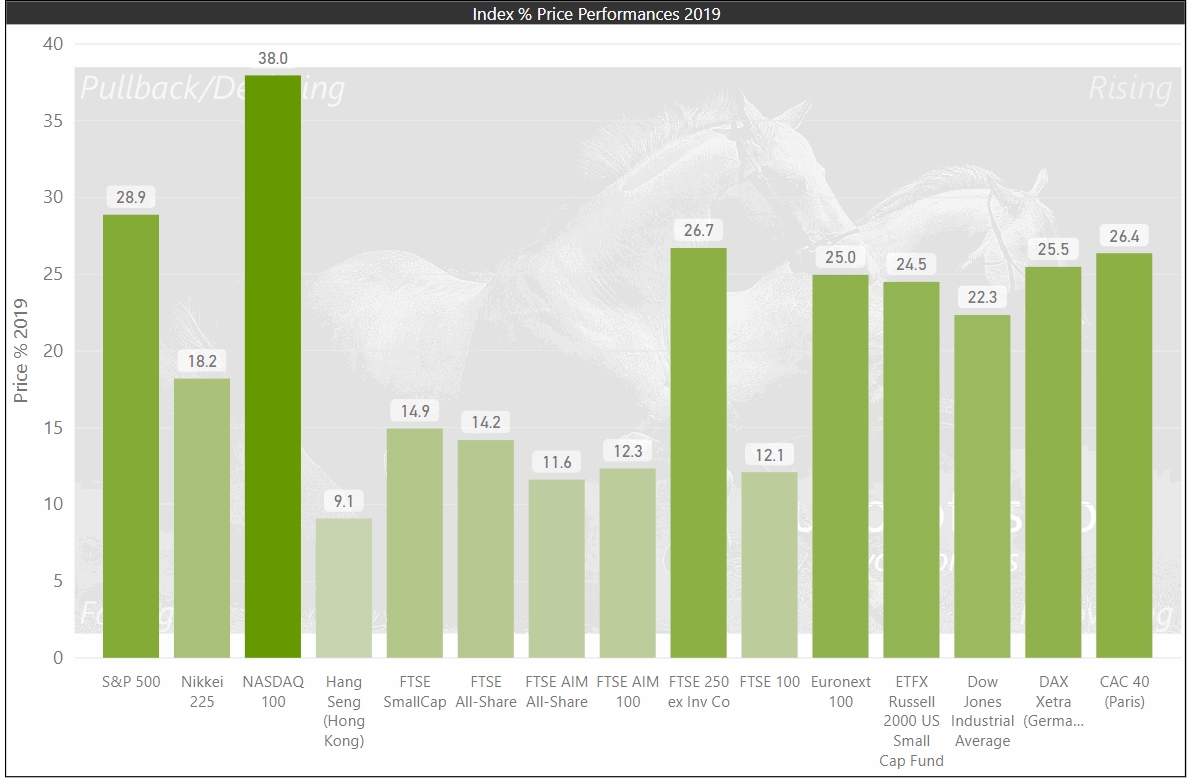
Figure 2 b. World Index Performances 2019
SYME UP 700% IN 29 DAYS (£230M)
SYME UP 700% IN 29 DAYS (£230M)
SP collapsed in April from 1.1p to less than 0.1p
Fell over May, June July then massive increase in volume as accumulation in Aug before big gap up on 8 Aug and then rise
Tell tales: volume in late July x10 increasing on up days while down days were much lower
RP VOL B from Aug 5,6 as cleared 8 EMA then gap up over 21 EMA
20.