FTSE 100 Strikes Back : Concentrated Cyclicals Currently in Vogue
FTSE 100 is the best performing index globally so far in 2022: 11 names in the index are up over 12% YTD while most small and mid caps are getting crushed.. This article takes a look at the big winners and identifies some trade ideas.
Given the negative start to 2022 in most stock markets, the FTSE 100 it is one of the few that is actually in the green YTD, up 1.1%. And while the top line is just over 1%, when you drill down you find a good few double digit gainers over the past few weeks- the likes of BP, one of the biggest mega caps in the UK stock universe, up almost 20% since the start of the year. That's a huge amount of capital appreciation in a massively liquid stock that pays a hefty dividend. In fact there are 11 names in the FTSE 100 up over 12% YTD while most small and mid caps are getting crushed.
In a volte-face reminiscent of a Dogs of the DOW, the footise is on the up as inflation, commodity price rises and raising interest rates favour many of its constituents and their beefy dividends. It distinct lack of tech names is another reason for its outperformance given the NASDAQ 100's fall of almost 15% in 2022
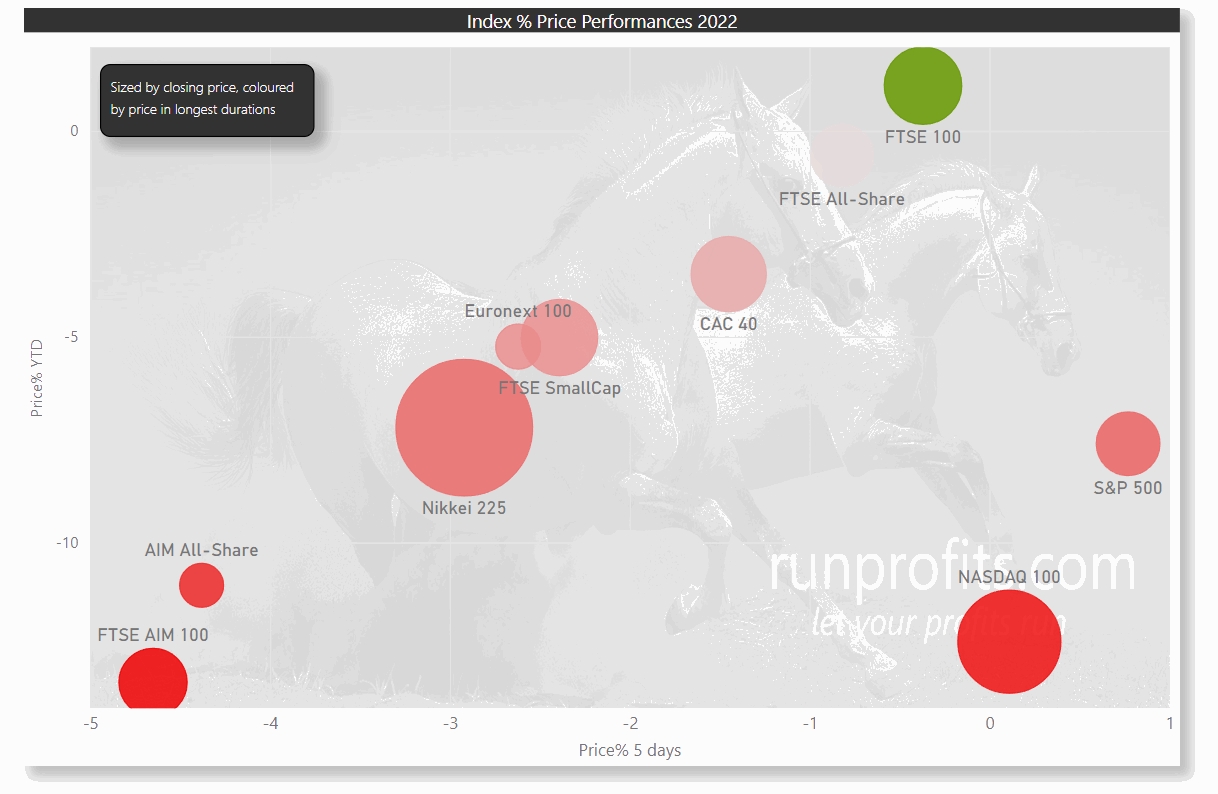
Here's a plot of indices in 2022 YTD - UK, Europe and Asia
UK stocks have underperformed their global counterparts over the past decade : compare the FTSE 100 below to the S&P 500: post the financial crisis the UK index has doubled while the US index has increased 6 fold (excluding dividends etc). This largely reflects the deflationary environment with low interest rates, accommodative monetary policy and the stealer rise in technology stocks (which are absent from the FTSE 100).


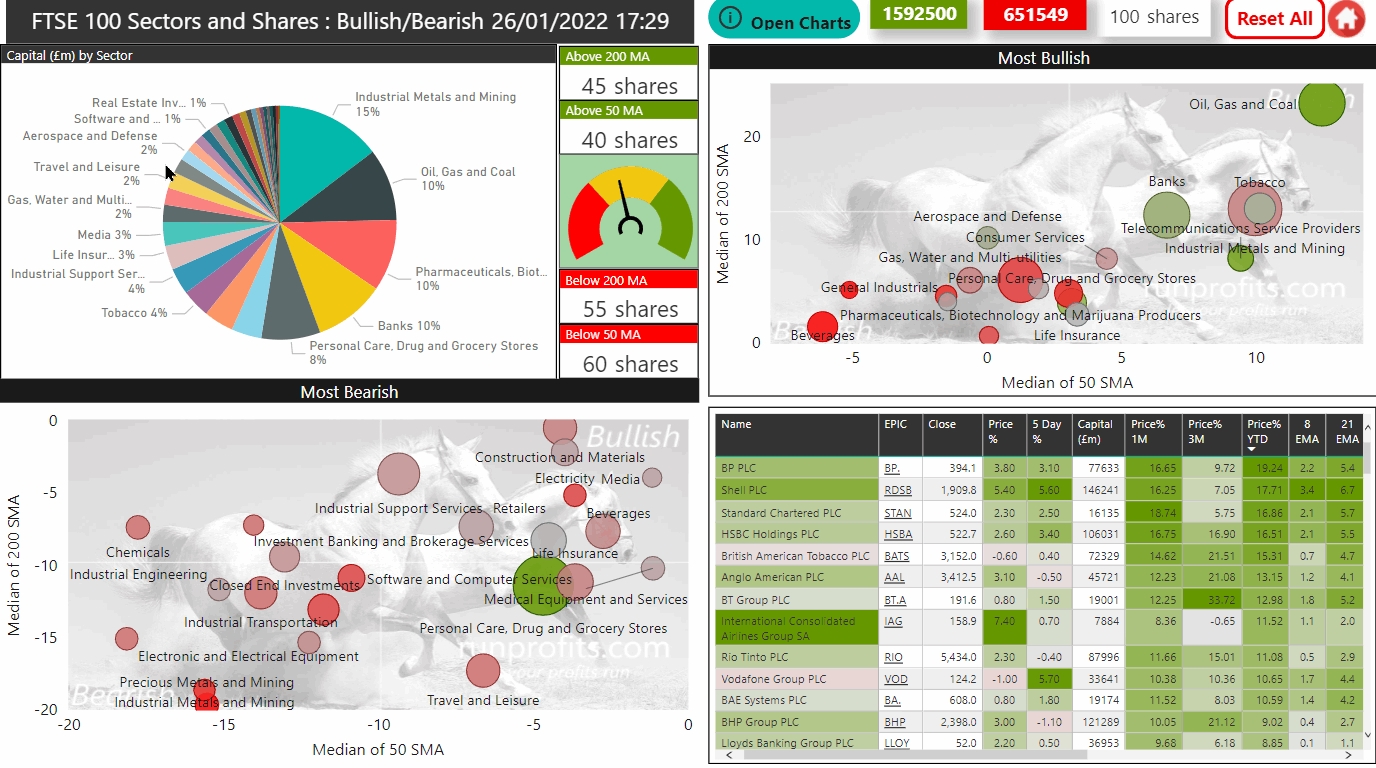
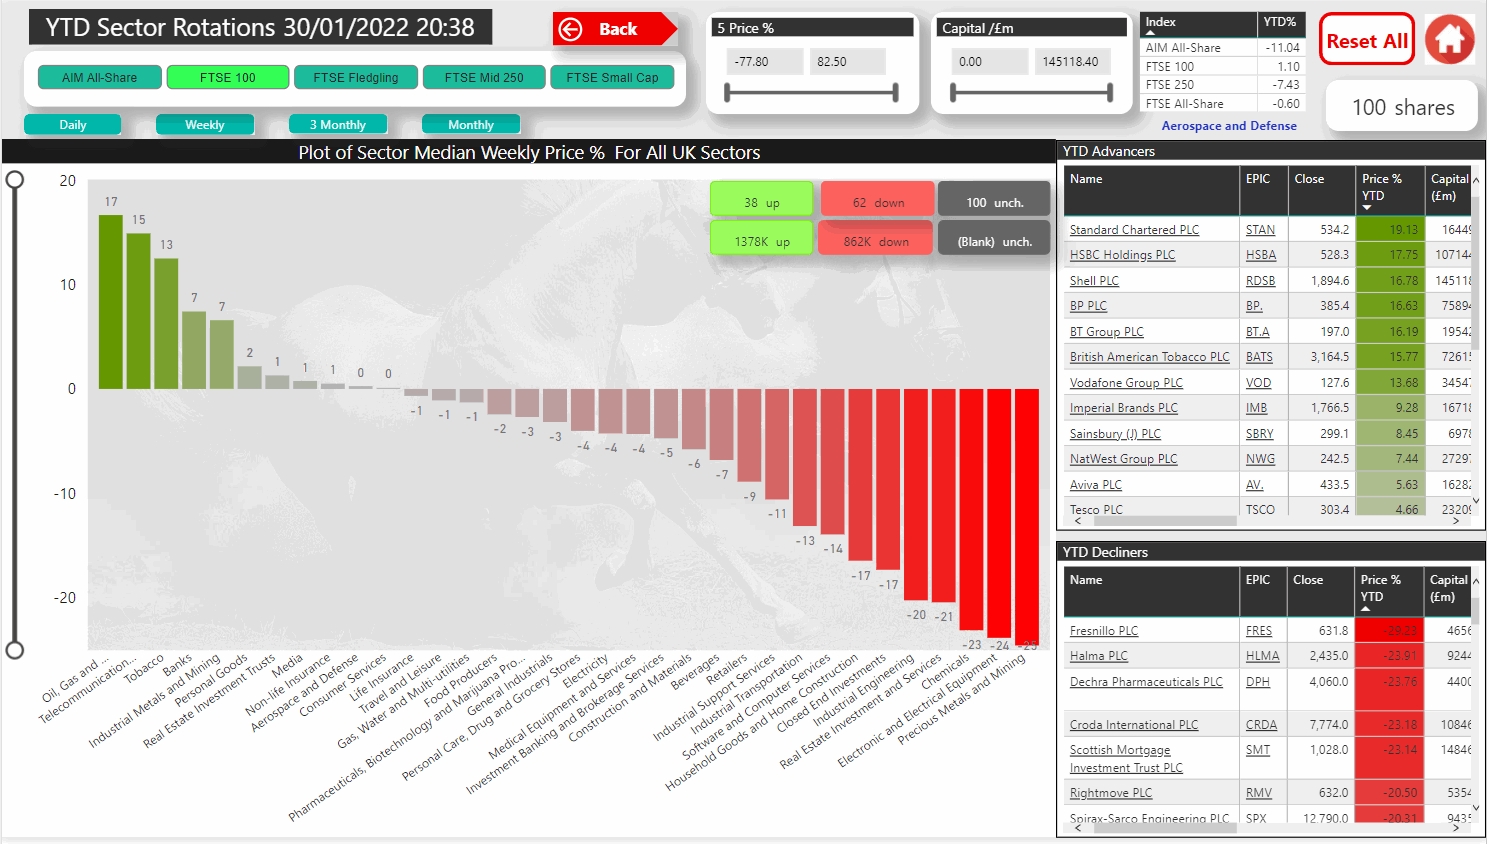
Looking inside the FTSE 100 the reasons for the outperformance are pretty clear: 42% of the index is made up of just 17 names by market cap and these are concentrated in Oil, Mining, Banking and Pharmaceuticals: many of these are up double digits in 2022 including BP and Shell up 19% and 17% respectively.
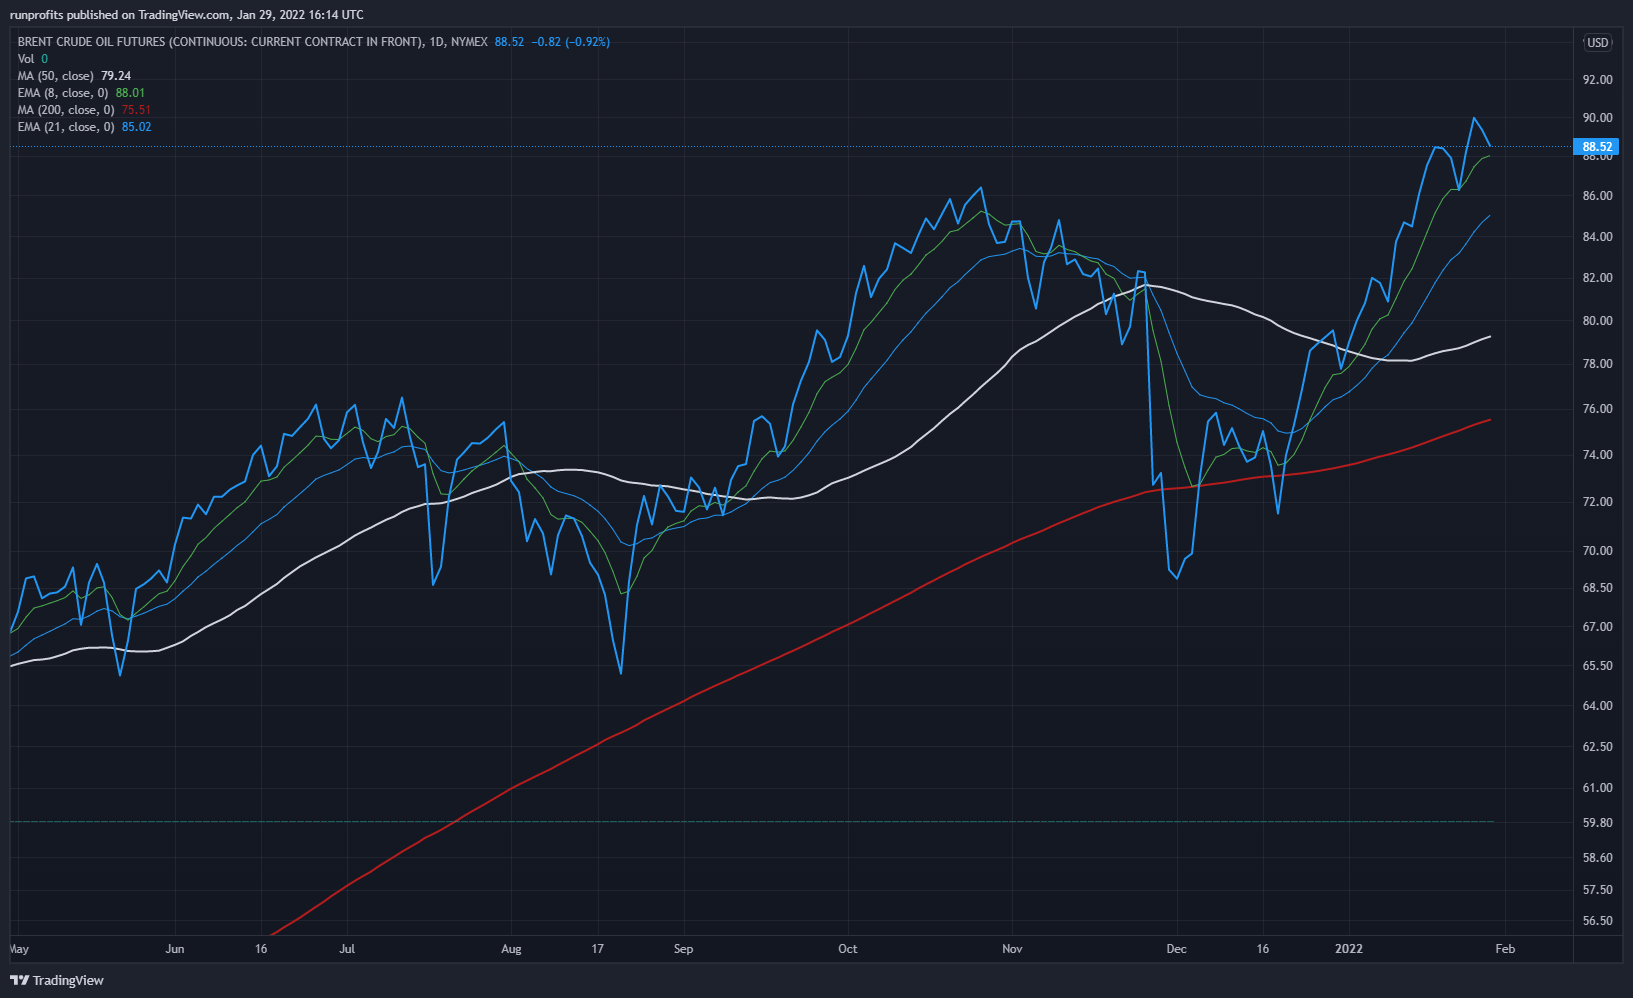
Oil is currently around $90/bbl up from $78 at the start of Jan 22. Similar rises in the base metals have been bullish the miners while the expectation of rising interest rates in 22 has lifted the banks.
Rising inflation tends to favour defensive stocks like utilities, tobacco and grocery: supporting BATS, VOD, AAl, BHP and lifting the overall index
Given the above, it is unsurprising that most of the heavy lifting done in the FTSE 100 YTD has been clustered in a relatively few stocks : while the 32 names are up YTD, 9 are up double digits and account for almost all of the price performance in the index : these are STAN, HSBC, RDSB, BP, BT.A , BATS , VOD, AAL and RIO. IMB , BHP and SBRY are close up around 9%
Trade Ideas
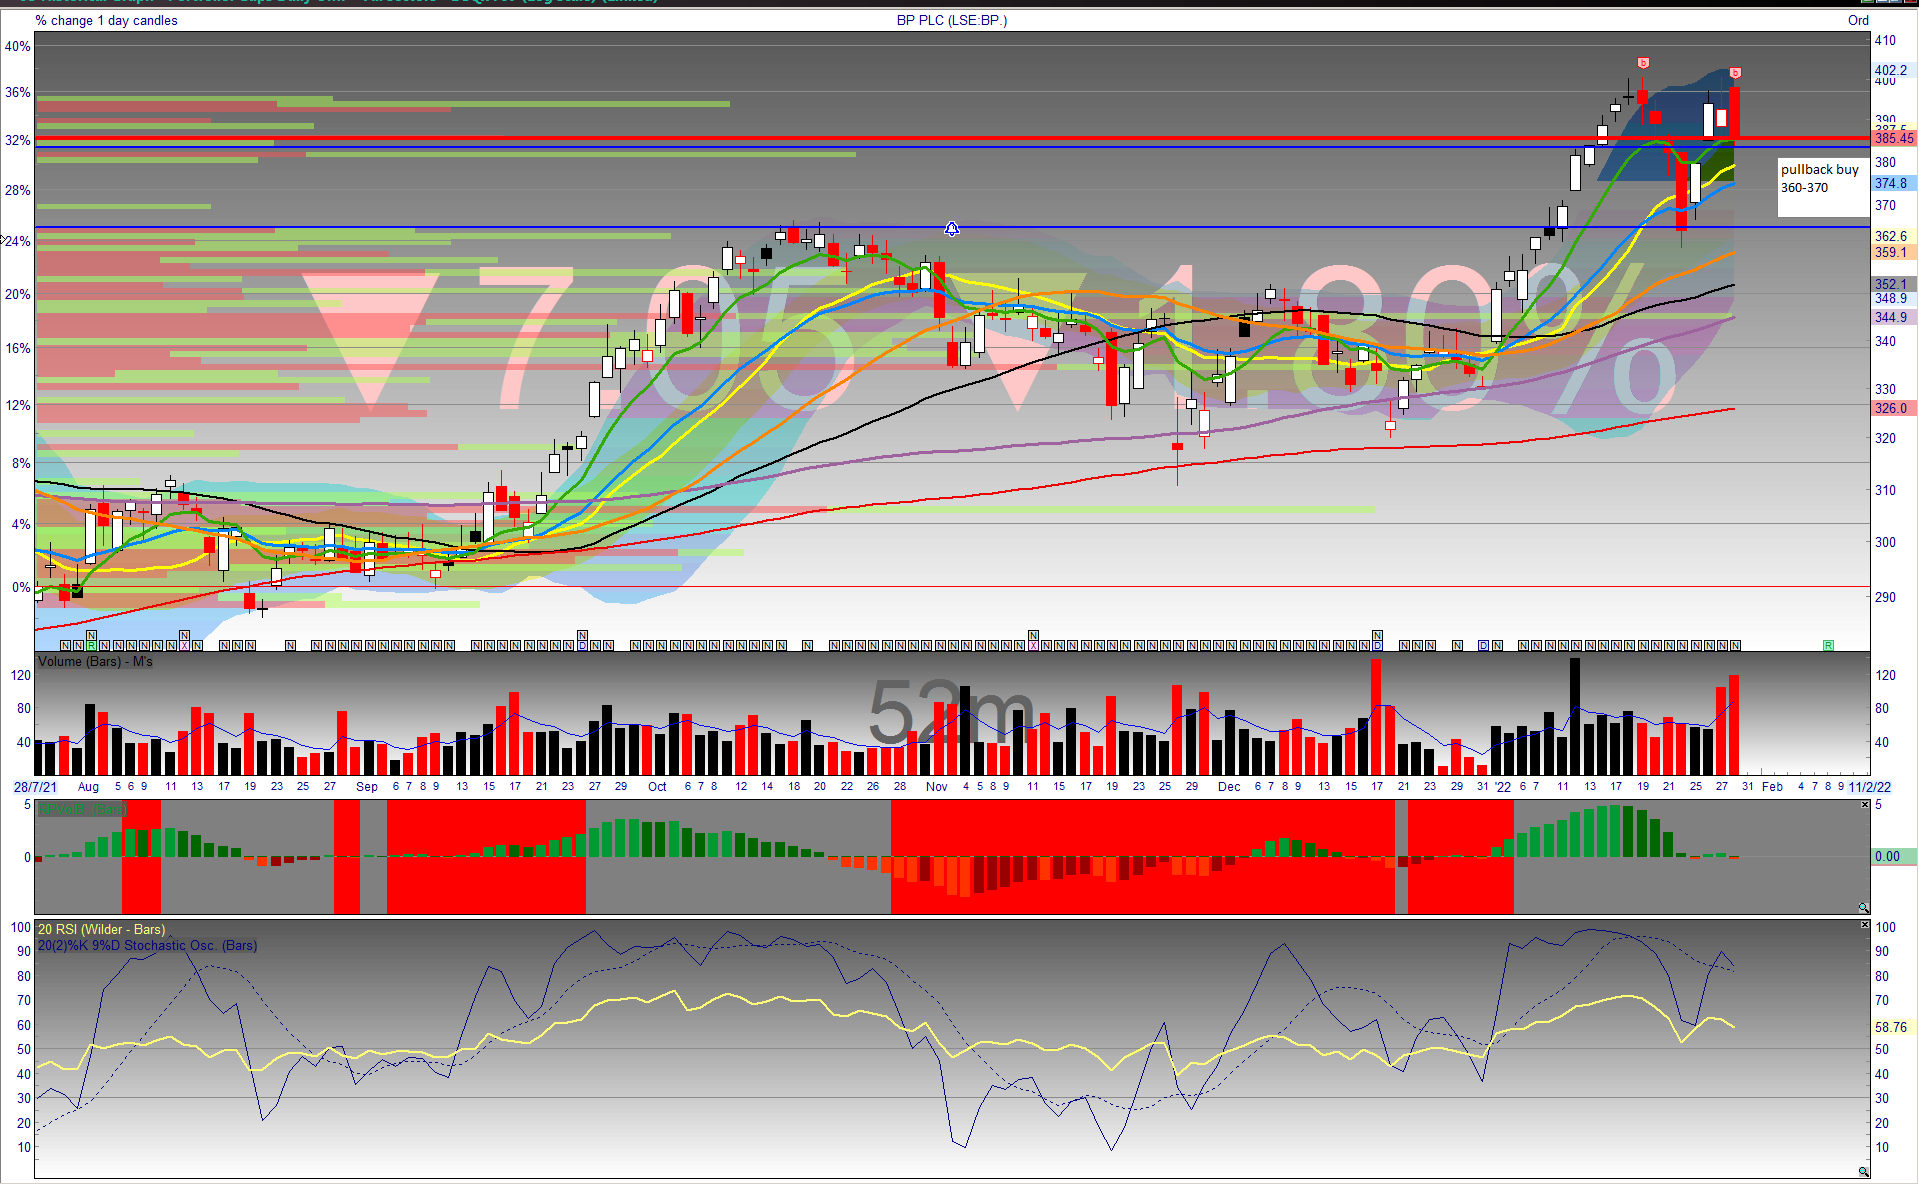
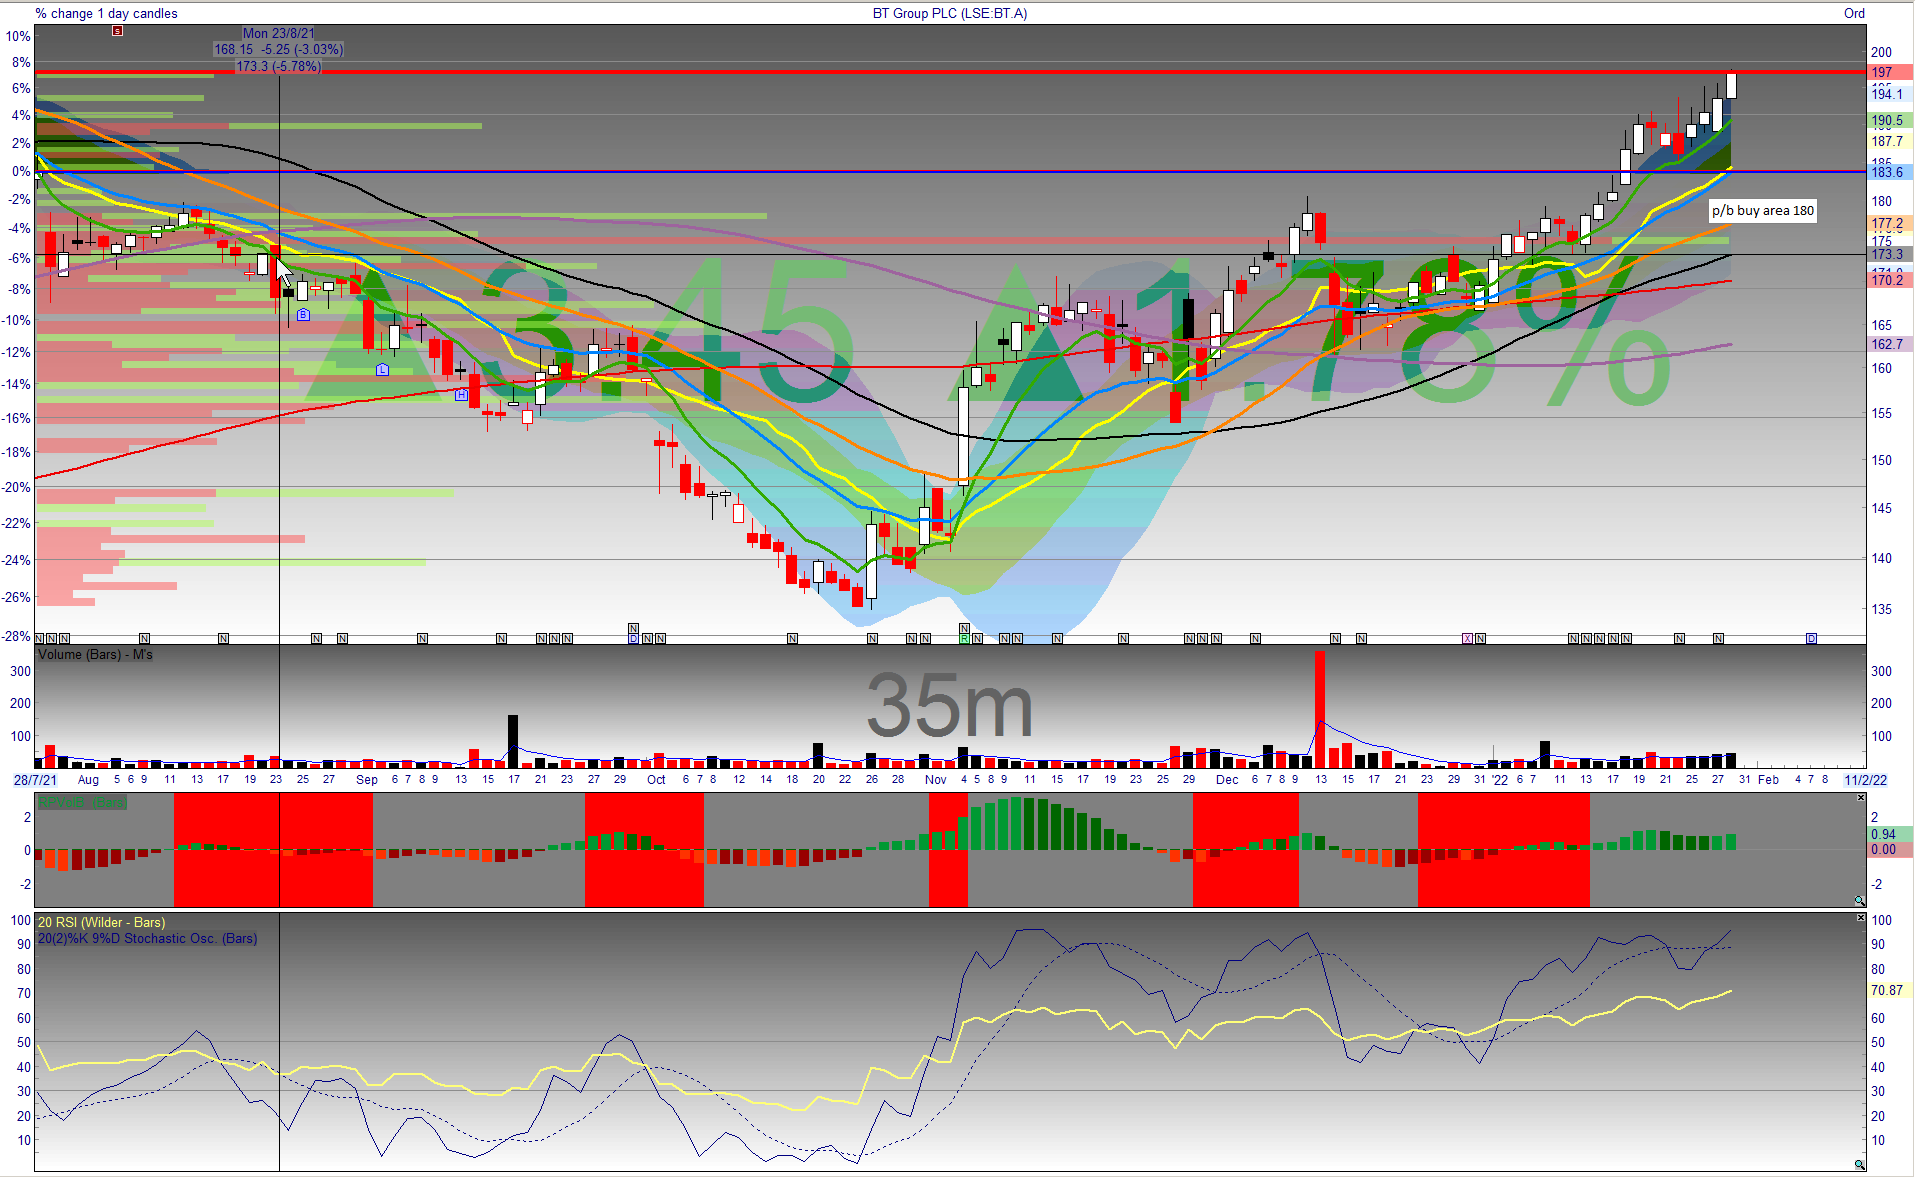
Most of the current leaders in the FTSE 100 are stretched in terms of their technicals: while they may continue to rally strongly, it is likely they will revert to a mean and consolidate some of the gains before advancing further. On indicative charts below the yellow line is the VWAP - a volume weighted average price: this is a good line in the sand for price as shares advance. They will frequently check back into this area and find demand before advancing further, fallback and stay below it the trend changes or oscillate around the VWAP as they consolidate moves. This is all heavily dependent on overall market behaviour and sentiment. Paradoxically, if we experience a sharp relief rally in mid and small caps following the recent sell-off: many of these big winners in January may well pillback: these are likely to be buying opportunities assuming the pullbacks are oderely and align to some simple setup rules
As an example, with the likes of TSCO, the VWAP also coincides with the 21EMA which is a 1 month price average. As a general rule of thumb, I tend to stay long MoMo shares like this until they have more than 2 closes below the 21 EMA . Three or more closes below the 21EMA on volume normally signals a change in trend or loss of momentum . The exception to this is where the 50 MA is near in which case price may check this before rallying. In either case, levels are also set from a money management and risk/reward point of view with partial take-profits depending on the details of each trade and the time horizons. Over the coming week or so I will be doing deep dive analysis on a number of these names. For disclosure , I am long RDSB, SBRY, TSCO NWG . These are positions that have been in place since 2021 with the exception of NWG which is an initial position on the recent pullback
TSCO : entry on pullback to 291 area stop below 270 OR breakout and close above 310 area with confirming volume (stop >2 closes below 291/21EMA) : target 360-370 region (potential resistance at 330-340 level)