Existing Members Log In Below
Access Institutional-Grade Research & Macro Insights
This analysis is restricted to active subscribers.
RunProfits delivers comprehensive, data-driven research powered by our proprietary data models, including the Alpha Catalyst Engine (ACE)—a bespoke, advanced LLM-based technology leveraging almost a decade of market data and two decades of market insight. Our independent framework provides rigorous top-down trend analysis combined with bottom-up actionable trading insights. This covers the gamut of market dynamics, delivering tactical trades and long-term trend analytics for serious retail investors who want powerful tools to do their own research.
"Access to the most advanced tools and data giving retail investors institutional-grade insights... THE best possible edge for their trading and investing."
Unlock the Full Research Suite
Join the Ace 2 tier to access unfiltered signals and complete analysis.
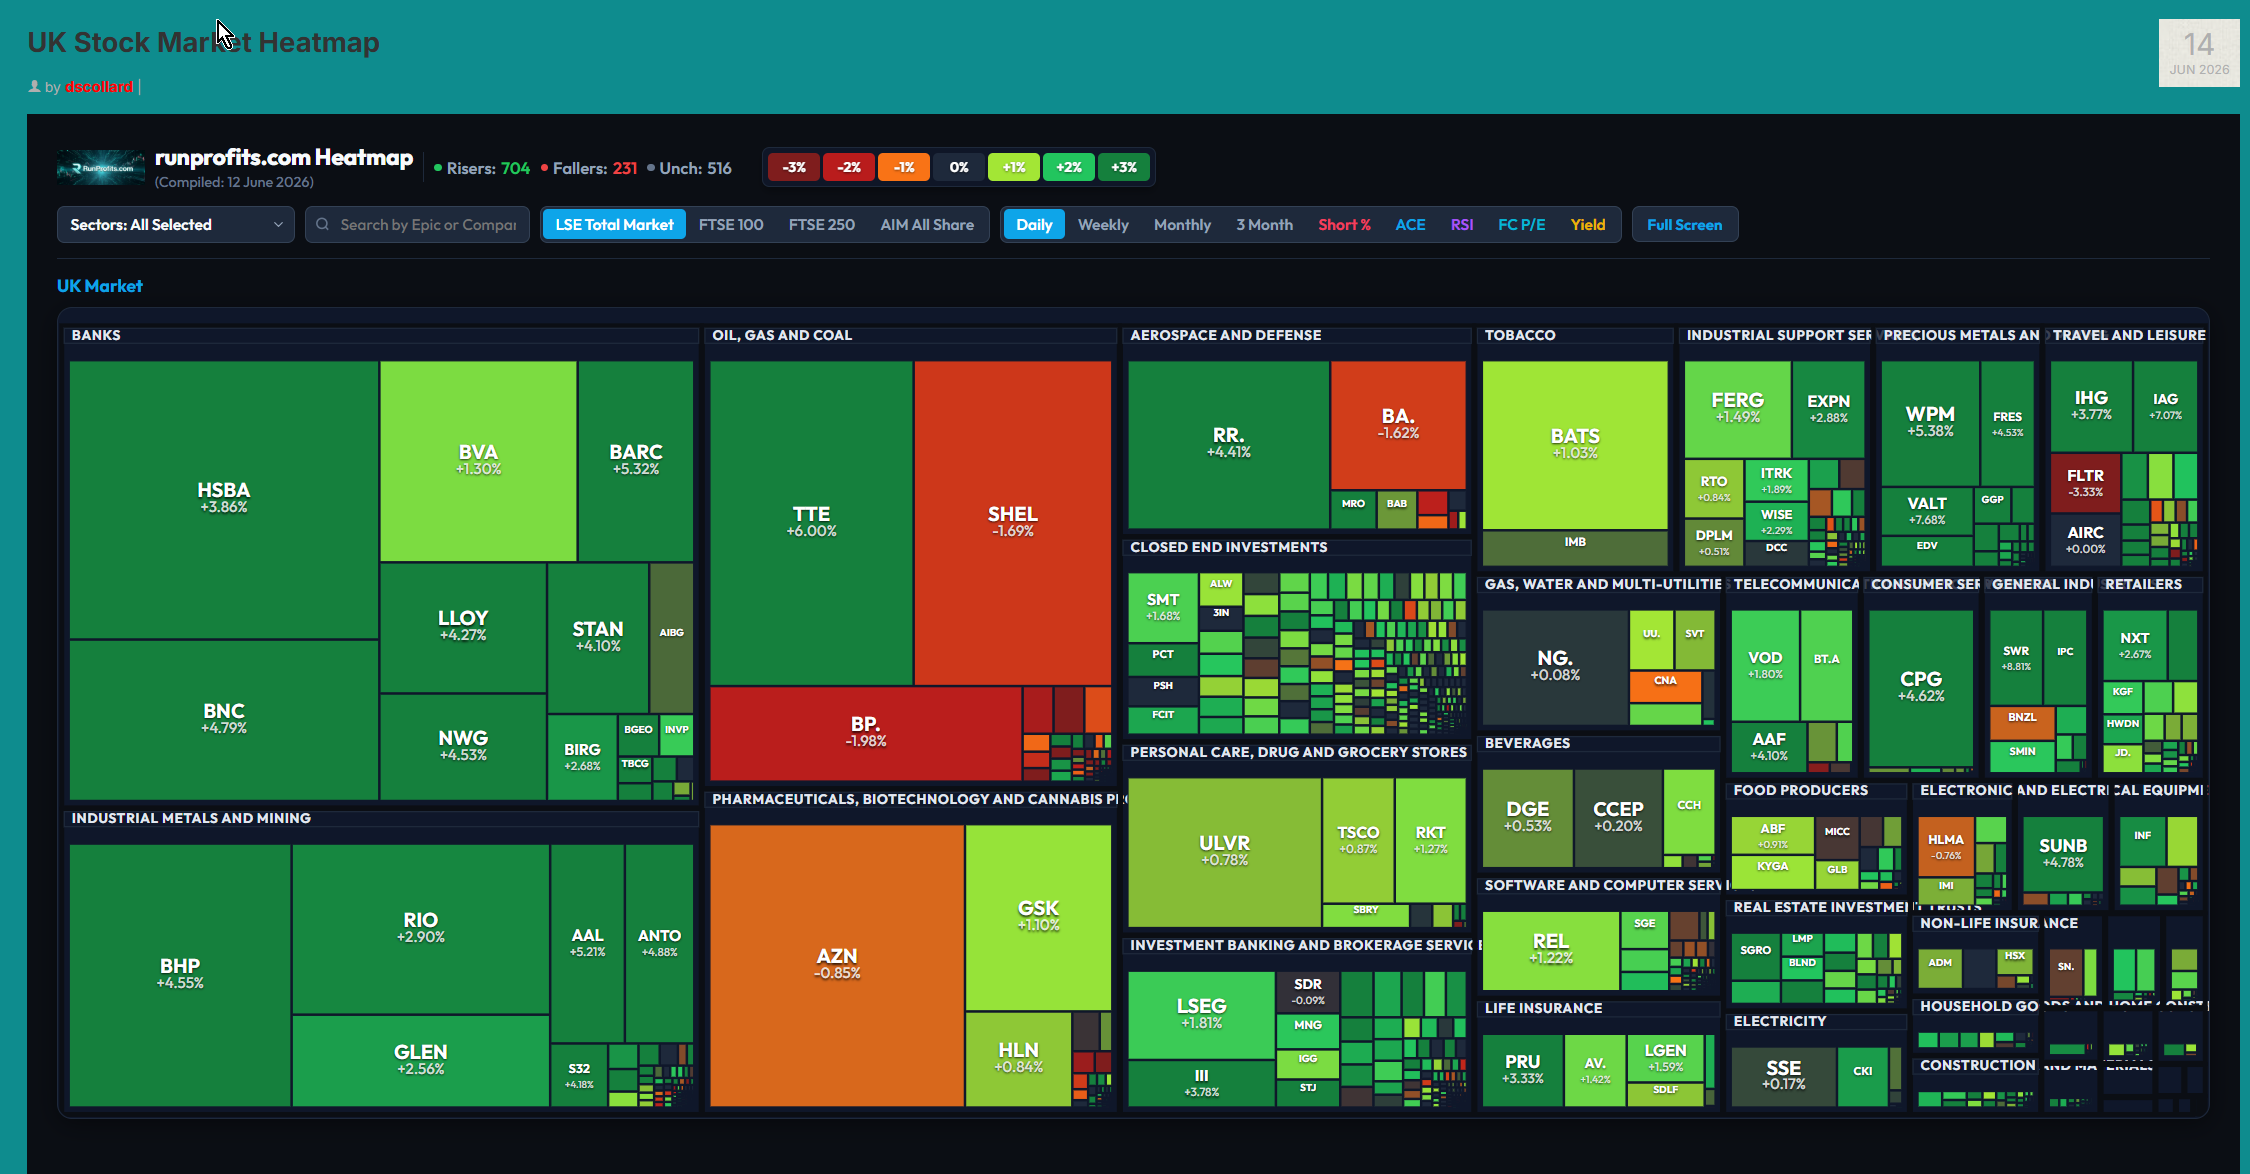
Sample Framework Output