Run Profits is now live with access to all the data reports for low cost monthly subs find out more ....
Oil at Key Support Trend Line -9% in a Week: Will it Bounce?
FTSE 100 , futures -15 on cash as the US ended last week largely in green led by the DOW with Healthcare, Consumer Defensives and Utilities outperforming
Friday's price action saw the FTSE250 catching a bid off the 8EMA which is bullish the uptrend while the AIM All Share similar found support around the 8 EMA
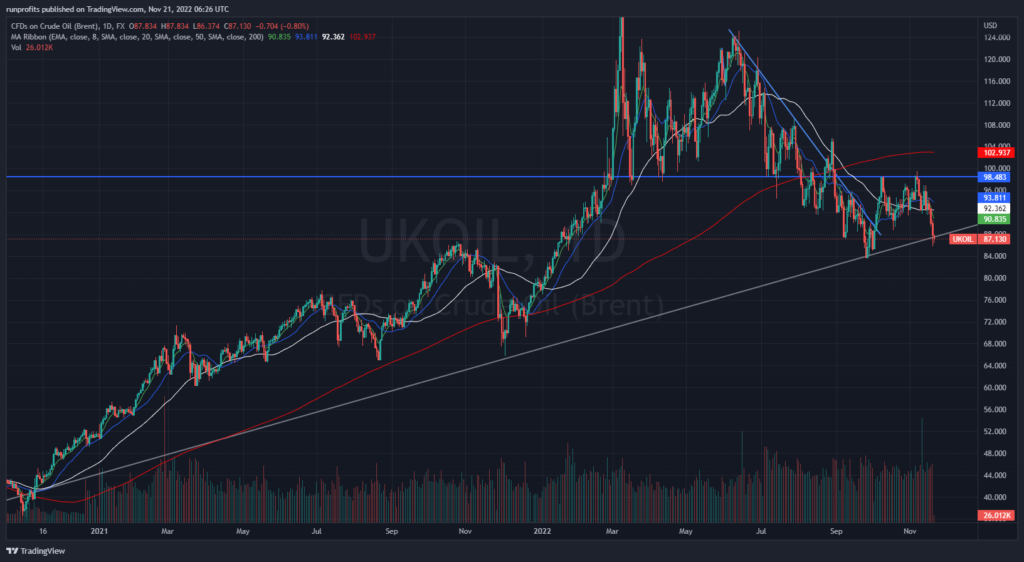
The big week loser was oil down 9% in 5 days and at a key support level back to the Feb '22 breakout . This trendline looks to be holding for now but was pierced on Friday: we may yet see weakness down to the $82/200 month MA: one to watch for a tactical trade
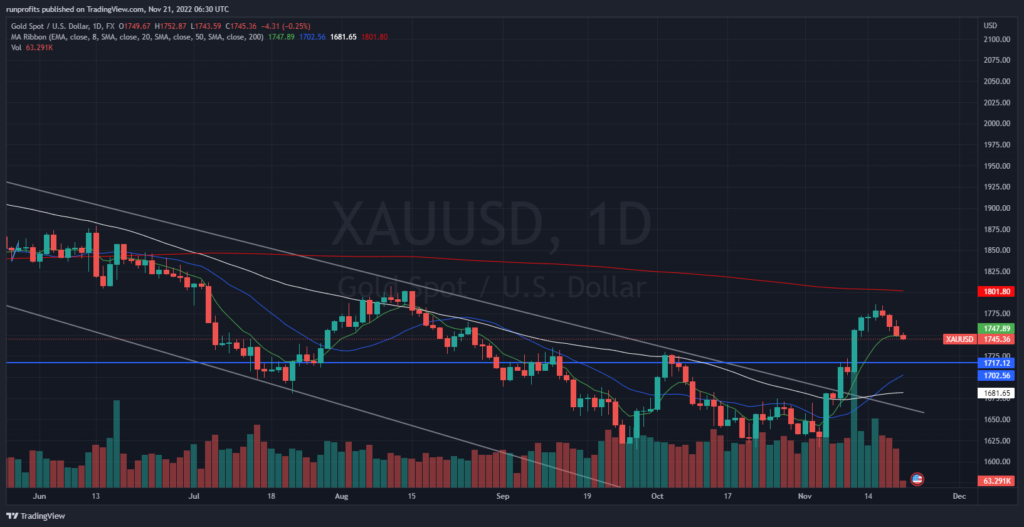
I have been watching gold waiting for a deeper pullback to add to my current long (or an extended run to $1800 to take profits): Gold has indeed blown off some more steam and come back to the 8 EMA around $1745. Will watch for some support here to renew the uptrend or further weakness to the 21EMA around $1702 with an overshoot to $1700 to check for support.
Oil at Key Trend Line : Weakness Suggest a Check of the $82 Level May be on the Cards
chart below shows oil as of 0630 finding support at the trendlien tracing back to the Feb '22 Ukraine war breakout. Previous tests of this level have held and given the recent drops of over 12% in 10 trading days we may see a relief rally to the 5EMA at $89: given the broader weakness, there is downside risk to test the $82.
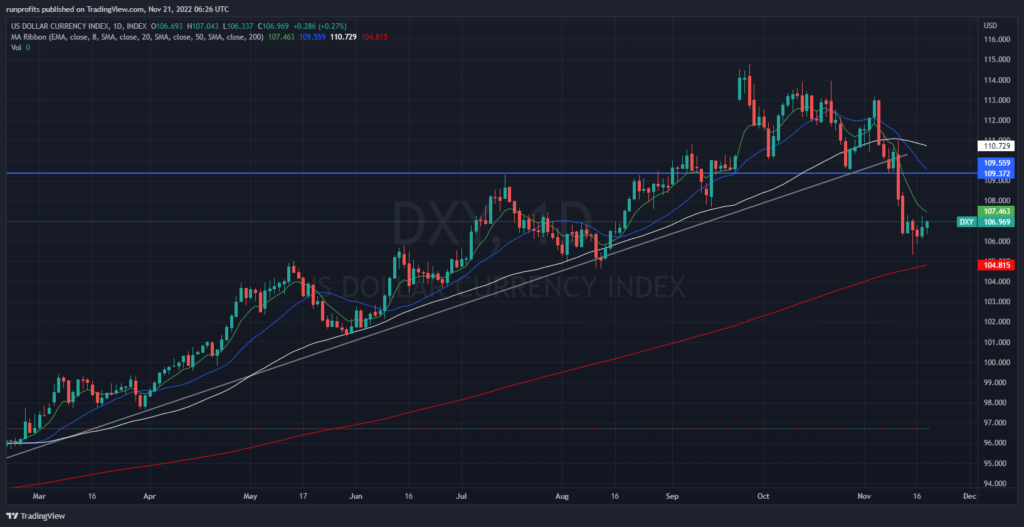
 Dollar Index at Support around $107

Gold Tracing the 8EMA May Look to $1702 and the 21EMA Before Continuing Uptrend
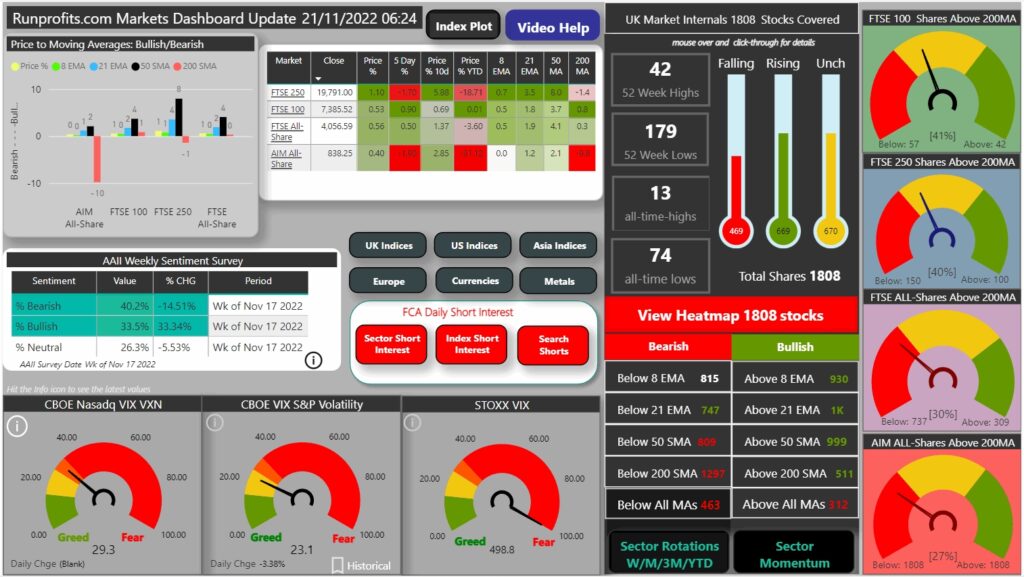
Market Dashboard and Sentiment:
VIX drops to 23 supporting risk on
US Heatmap as of Close Friday 18 Nov 22
Econ Calendar
Today's economic calendar RGerman PPI at 0700


