Contents: Click on Link to View
ToggleDaily RPG Reports: Hit + to Expand Tab and Access Report: (Latest Update Open by Default)
Publication Schedule
below times are indicative and can be subject to data availability and prone to occasional technical issues. The purpose of this is to find trading opportunities and not to provide a comprehensive or accurate news service. The London Stock Exchange publishes regulatory news here . This should be the ultimate source to verify any RNS type data
- 1. Pre Market RNS 07:15 : identify potential catalysts in RNS to trading opportunities based on chart set-ups: scope potential positions for market open
- 2. AM Liquidity 08:15-09:00 : market responses and price reaction to overnight/RNS catalysts : identify good entry points for trades (breakouts/downs, gaps) in early liquidity
- 3. Pre Close 15:00-15:30 captures the impact of US participation/enhanced liquidity and identifies potential setups before market close
Click on a tab below to open the RNS Report
Click on EPIC to open the chart Click on Headline to Open RNS Click on Time Stamp to see all recent News Help and Navigation
Daily Shares in Focus
[stock_market_widget type="comparison" template="basic" color="teal" chart_range="1d" chart_interval="5m" assets="DOCS.L,ESKN.L,ORPH.L,PTAL.L,888.L" fields="name,change_abs,change_pct,volume,market_cap,chart,open,high,low,last_update" api="yf" style=" width: 1200px; margin-left: auto; margin-right: auto; background-color: white;"]RNS Analysis and Opening Price Action
RNS Report is published at 07:15 each day (approximately) and may be updated during the day to reflect the total RNS newsflow for that day : timestamp on the report indicates the latest update
Pre Market RNS
Pre Market Analysis 06:30
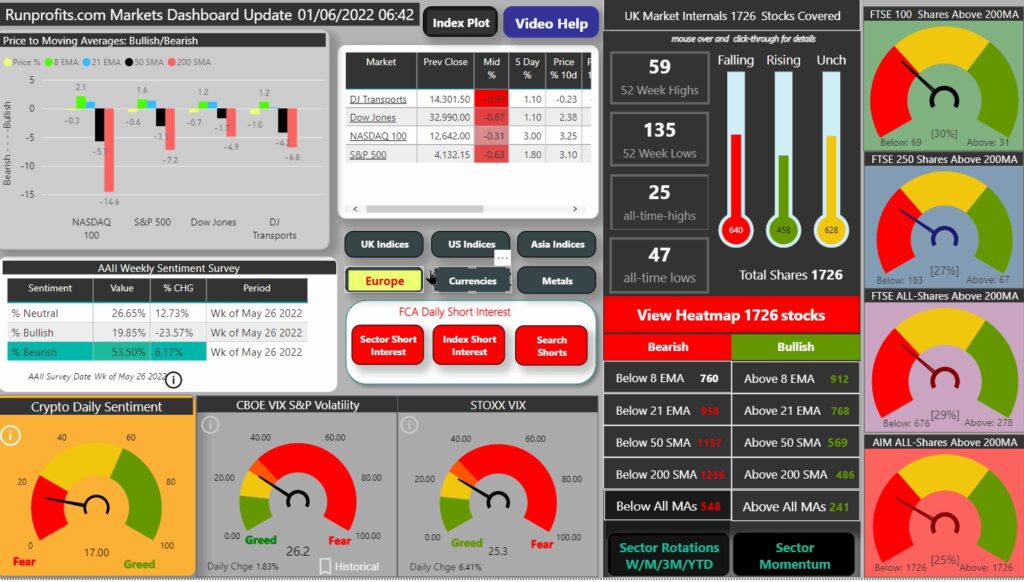
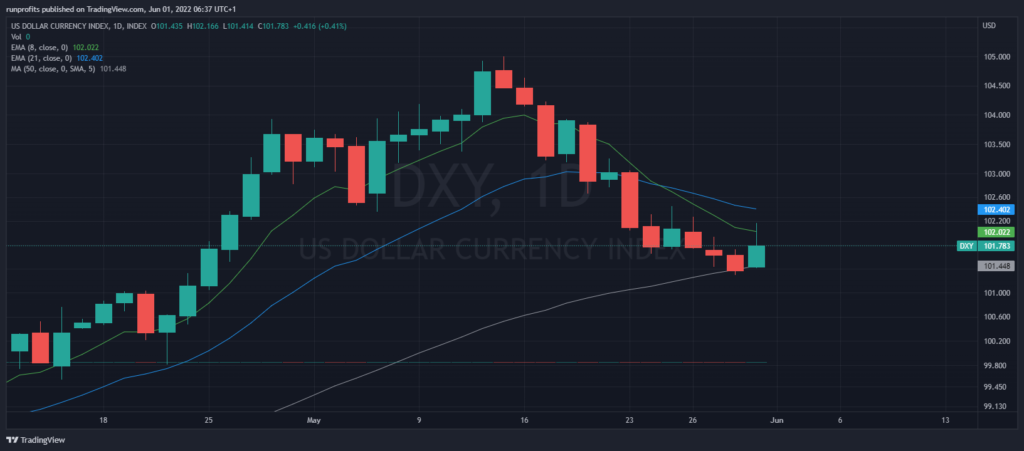
Final trading day of UK shortened week sees FTSE futures unchanged on cash close at 7607 following end of month in the US close mildly red but holding recent gains with NASDAQ/tech outperforming: banks up, oil and healthcare down Gold below 200MA , oil slight pullback , DXY reasserts uptrend after 50MA check
- - US stocks map sees oil & gas names trim gains as banks and tech advance
- - Brent crude slight pullback to $115 from yesterday's $121 spike(chart)
- - VIX at 26.2 VSTOXX 25.3
- - DXY- dollar index 101.8 - rallying from a 50MA check yesterday
- - Copper sideways and below 21EMA lacking direction
- - Gold loses 200MA at $1830 - chart
Charts - click to open to full size
US Stockmap
Gold Chart
DXY Chart
Oil Chart


