Contents: Click on Link to View
Toggle
Please add me to runprofits.com mailing list for future articles and trade ideas
Weekly Wrap: Indices Bullish But Cautious, Oil off the Boil
While Friday ended with all UK indices mildly in the red, the week was positive across the board except for the TechMARK and all of the UK indices remain bullish across short, medium and long term time-frames.
In market breadth terms, more shares fell in price this week (872) than rose in price (774).
There are several signs that market sentiment has become more cautious as macro concerns broaden with the global economic impact of the coronavirus being assessed.
Oil prices have dropped sharply losing 5.5% on the week (almost -18% YTD) for Brent crude but finishing off lows and north of $55.
- AIM 100 up 1.8% AIM All-Share up 1.4%.
- FTSE 100 gaining 1.7%.
- FTSE 250 up 0.9%.
Figure 5 below shows how the slide in commodity prices have been playing out on the basic resource sectors as Mining and Oil and Gas shares come under pressure. By contrast, shares in the alternative energy sector have risen sharply as investors favour these greener options.
Clearly sentiment (if not demand and global macro) currently heavily favours alternative energy which may make holding long positions in basic resources painful for the foreseeable future.
Weekly Wrap: AIM on the Gain
As highlighted in the 2019 look-back in January, AIM is outperforming the other indices as the small caps play catch-up from their underperforming in 2019.
132 AIM shares have rallied in 2020 with BOIL up 142%, GGP up 117% and 12 shares up over 50% in 2020 YTD.
in the RP Scanner, use Page 19 to screen for shares by Index and by Sector: the sliders on the right allow you to screen by price gain and by price action so you can exclude any shares making losses : shares below their 200 day moving average or equally screen by capital or volume.
Figure 4: 132 AIM Shares Gaining in 2020
Figure 3: Major Indices Performance in 2020
Figure 2: Index Performance Weekly
View at The Half 14:00 Update
As highlighted earlier, markets have pulled back some what today led by the resource sectors as O&G services, Industrial Metals and Mining all slipped by 2-3% by 14:00. Gold continues to look strong despite a significant beat of the expected US jobs NFP number. The strong employment growth may stymie chances of a rate cut which in turn is positive dollar and negative stocks: one of those good news is bad news scenarios.
US futures were down just 0.5% at 14:00 suggesting a muted response while Gold has rallied 0.25% to clear $1570 on spot.
More US Record Highs: Time for a Pause?
Overnight saw the US markets make even higher highs as the S&P added 0.3% while the DOW Jones matched that in percentage but didn't exceed its previous ATH. The NASDAQ closed flat on the day making a double top as well. Given the slowing of momentum, the recent pullback that was snapped up a bit too quickly , and the failure to make substantial new highs this may well be signalling time for a pause and deeper pullback. The Dow Jones Transportation index failed to rally with the other indices which is often a sign of weakness.
Oil remains weak at $55 for Brent while commodities have shown some recovery but again are significantly down on the year
- The VIX ,while low at around 15, is elevated compared to its recent base of around 12.
- The Fear and Greed index has stayed in the low 60's off recent highs of 90+:
- Gold has remained pretty bullish and suggest that there may be increased safety trades in play as the yellow metal has been in a strong uptrend since summer '19 and looks set for an assault at $1600 - see chart.
these suggest that more protection is being sought to the downside potentially indicating more caution with fingers over sell buttons.
Today is US monthly employment figures, the NFP: this may well provide an excuse for a sell-off.
Alternatively we may well grind higher but recent tremors do favour more downside
Updated 07.10

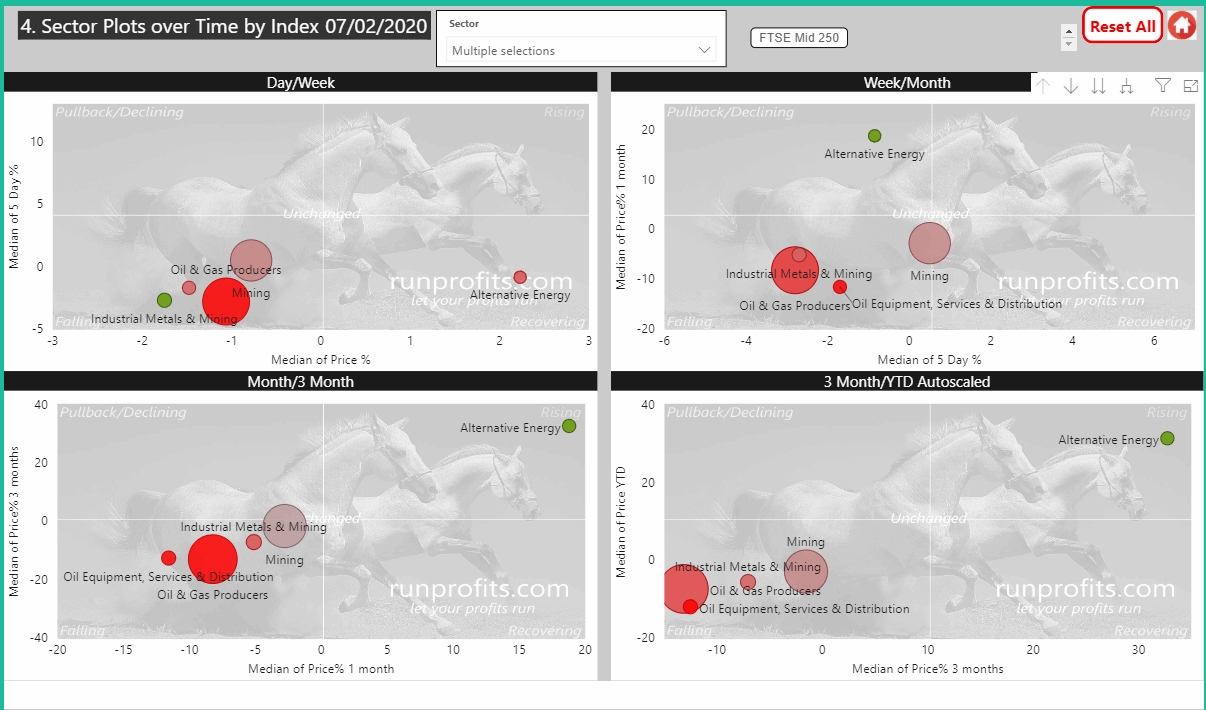
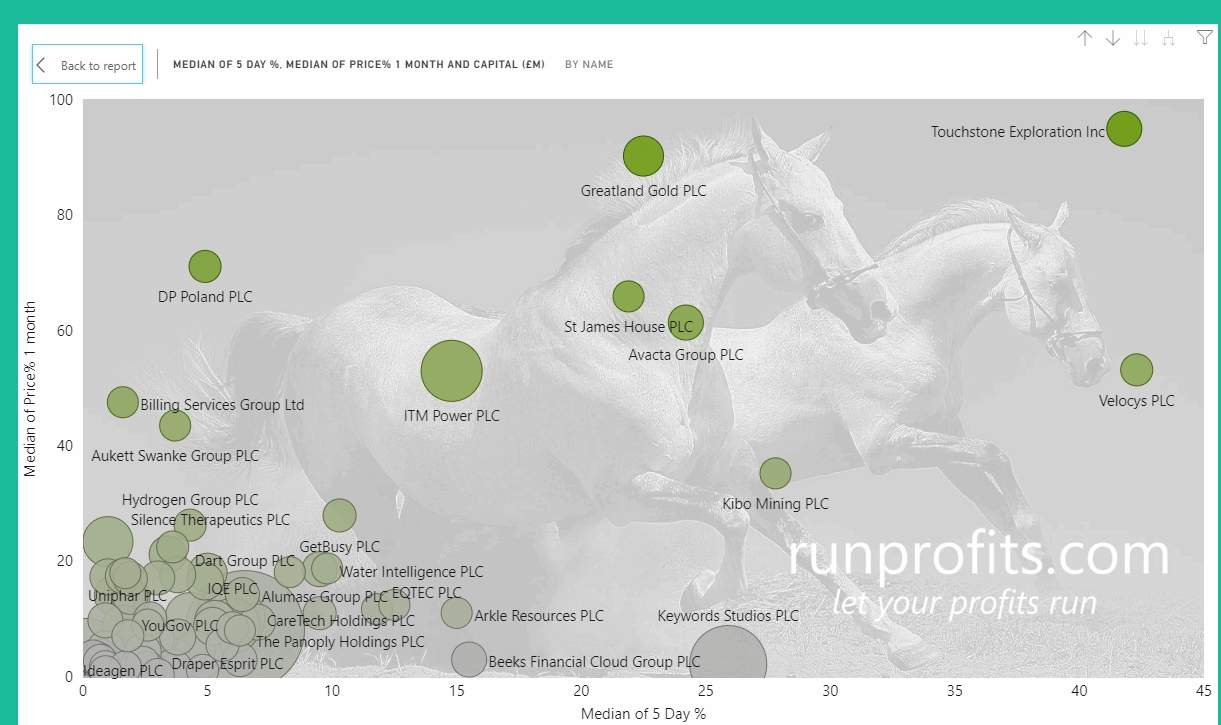
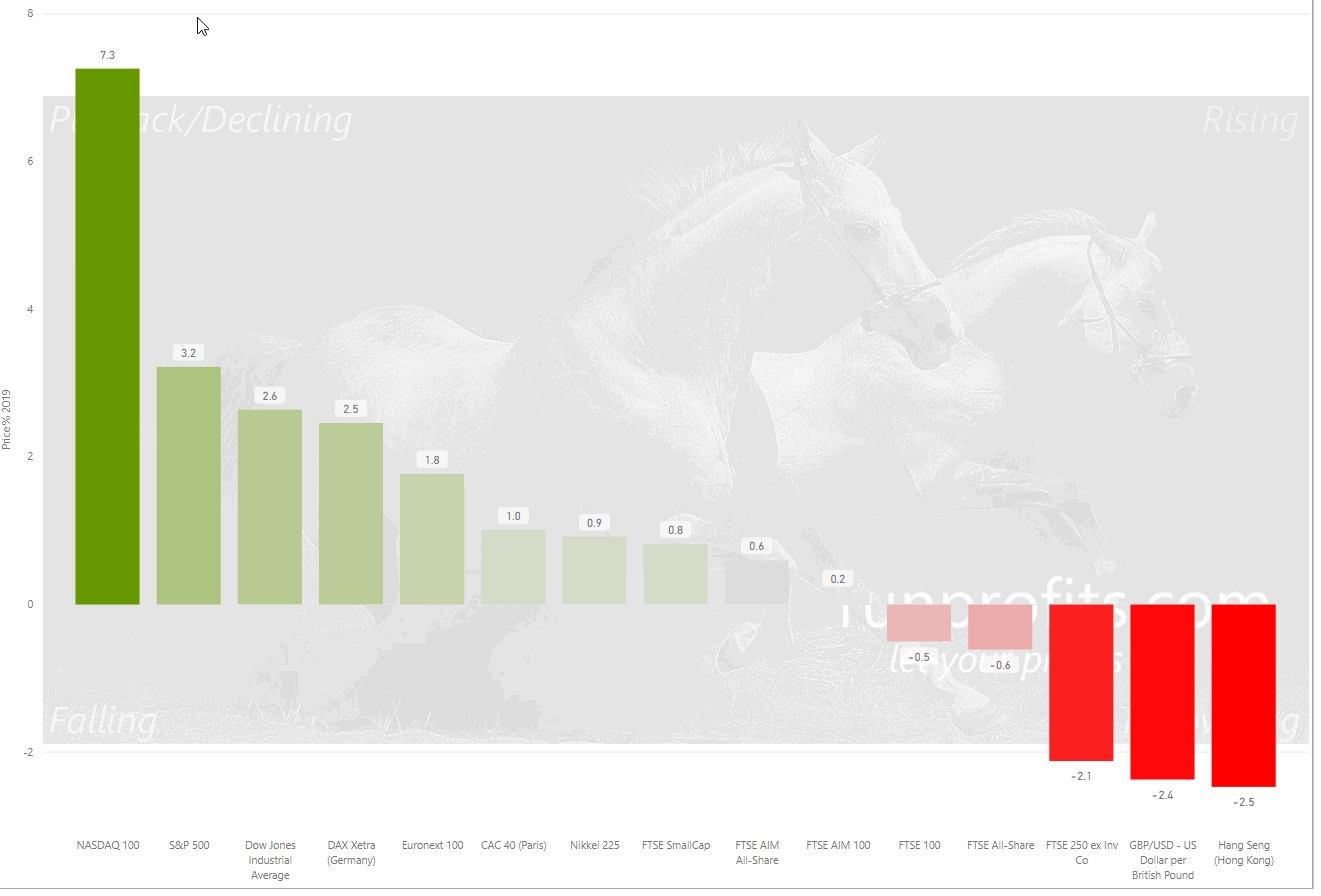
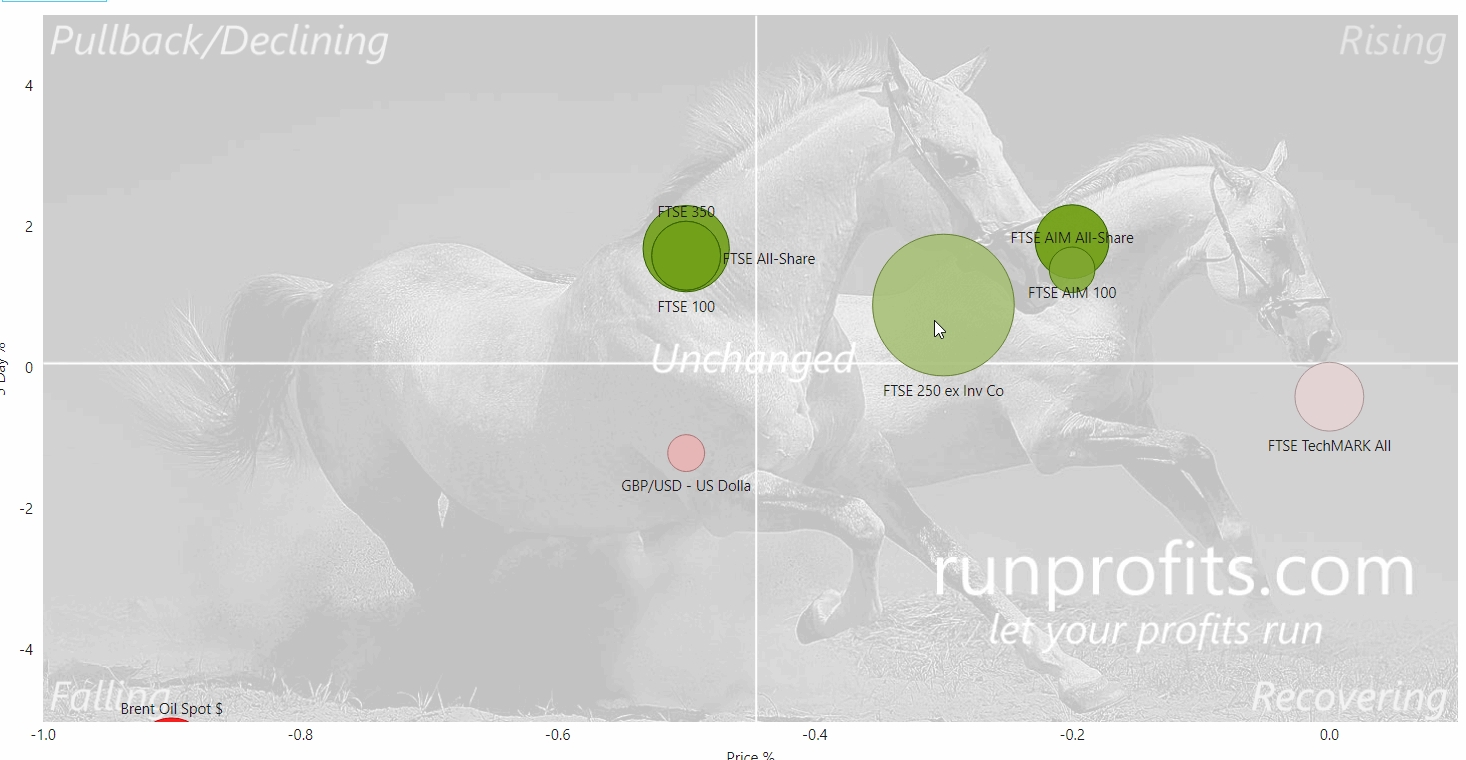
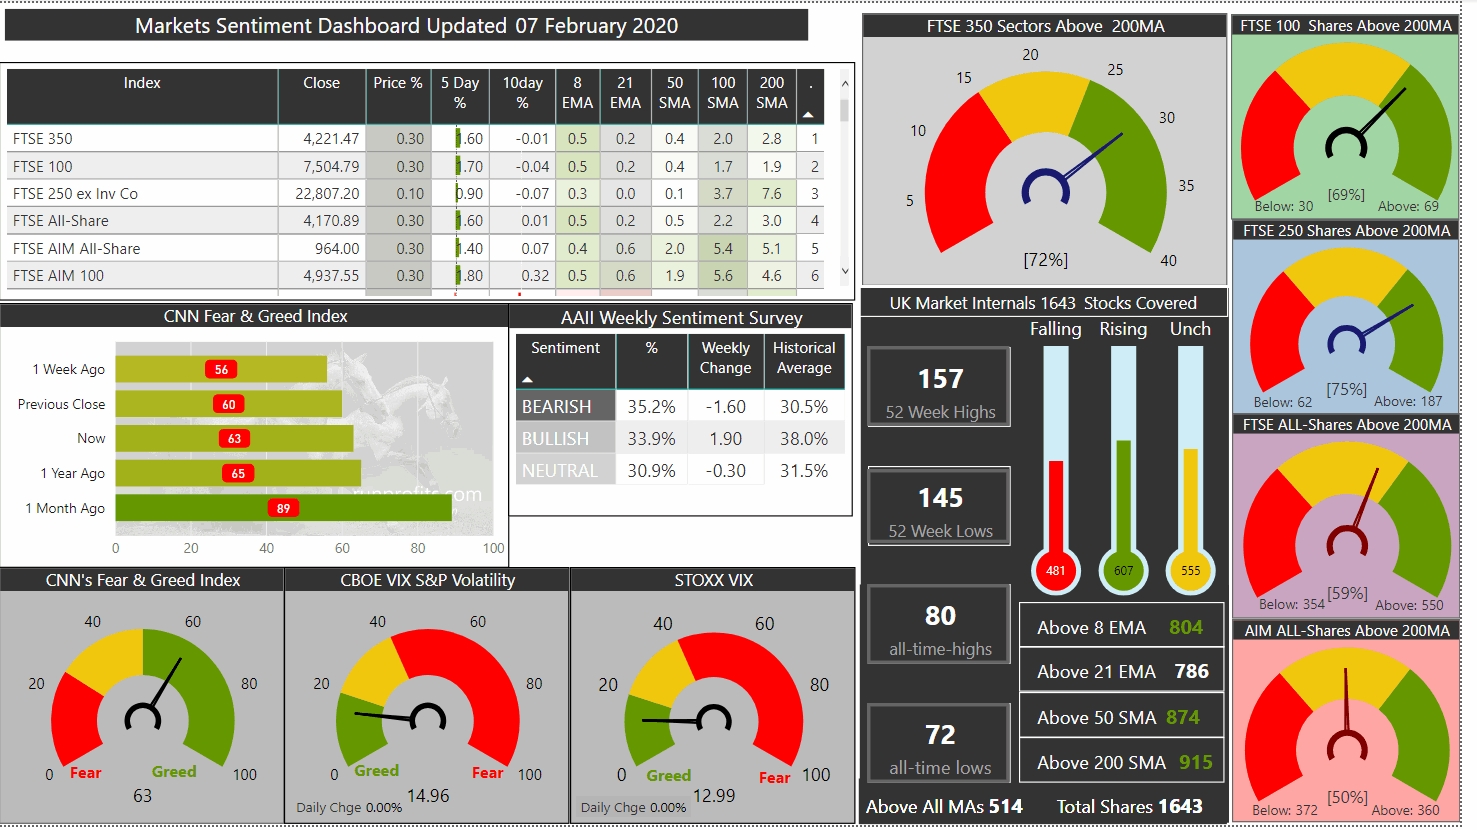
Figure 5: Basic Resources Under Pressure as Commodities Slide