
Contents: Click on Link to View
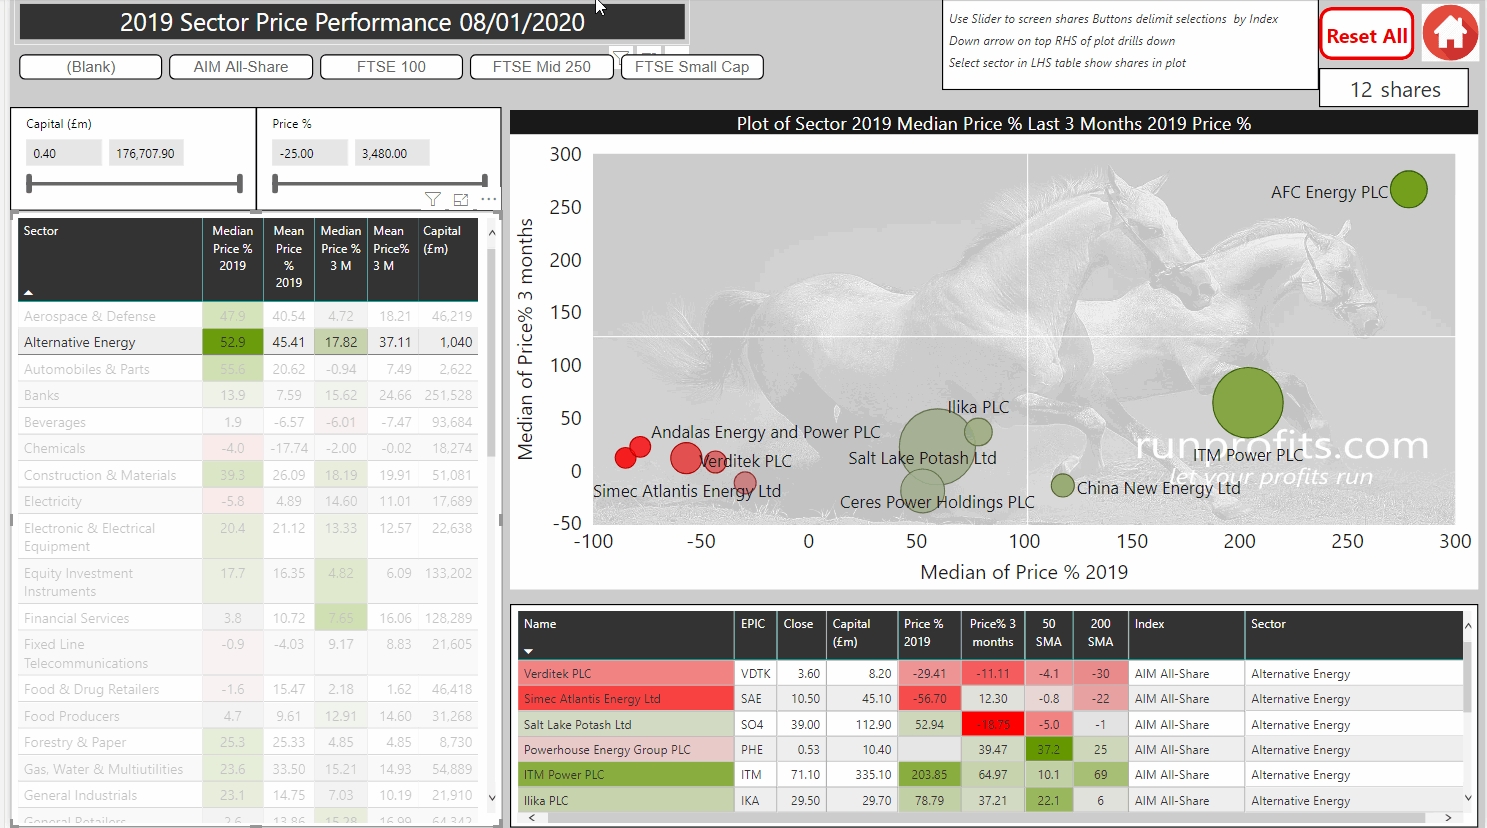
ToggleOpen the interactive report to review the analysis and do your own research
Click to view the data-set and carry out your own in-depth analysis using the interactive reporting tools
2018: Beware The Bear
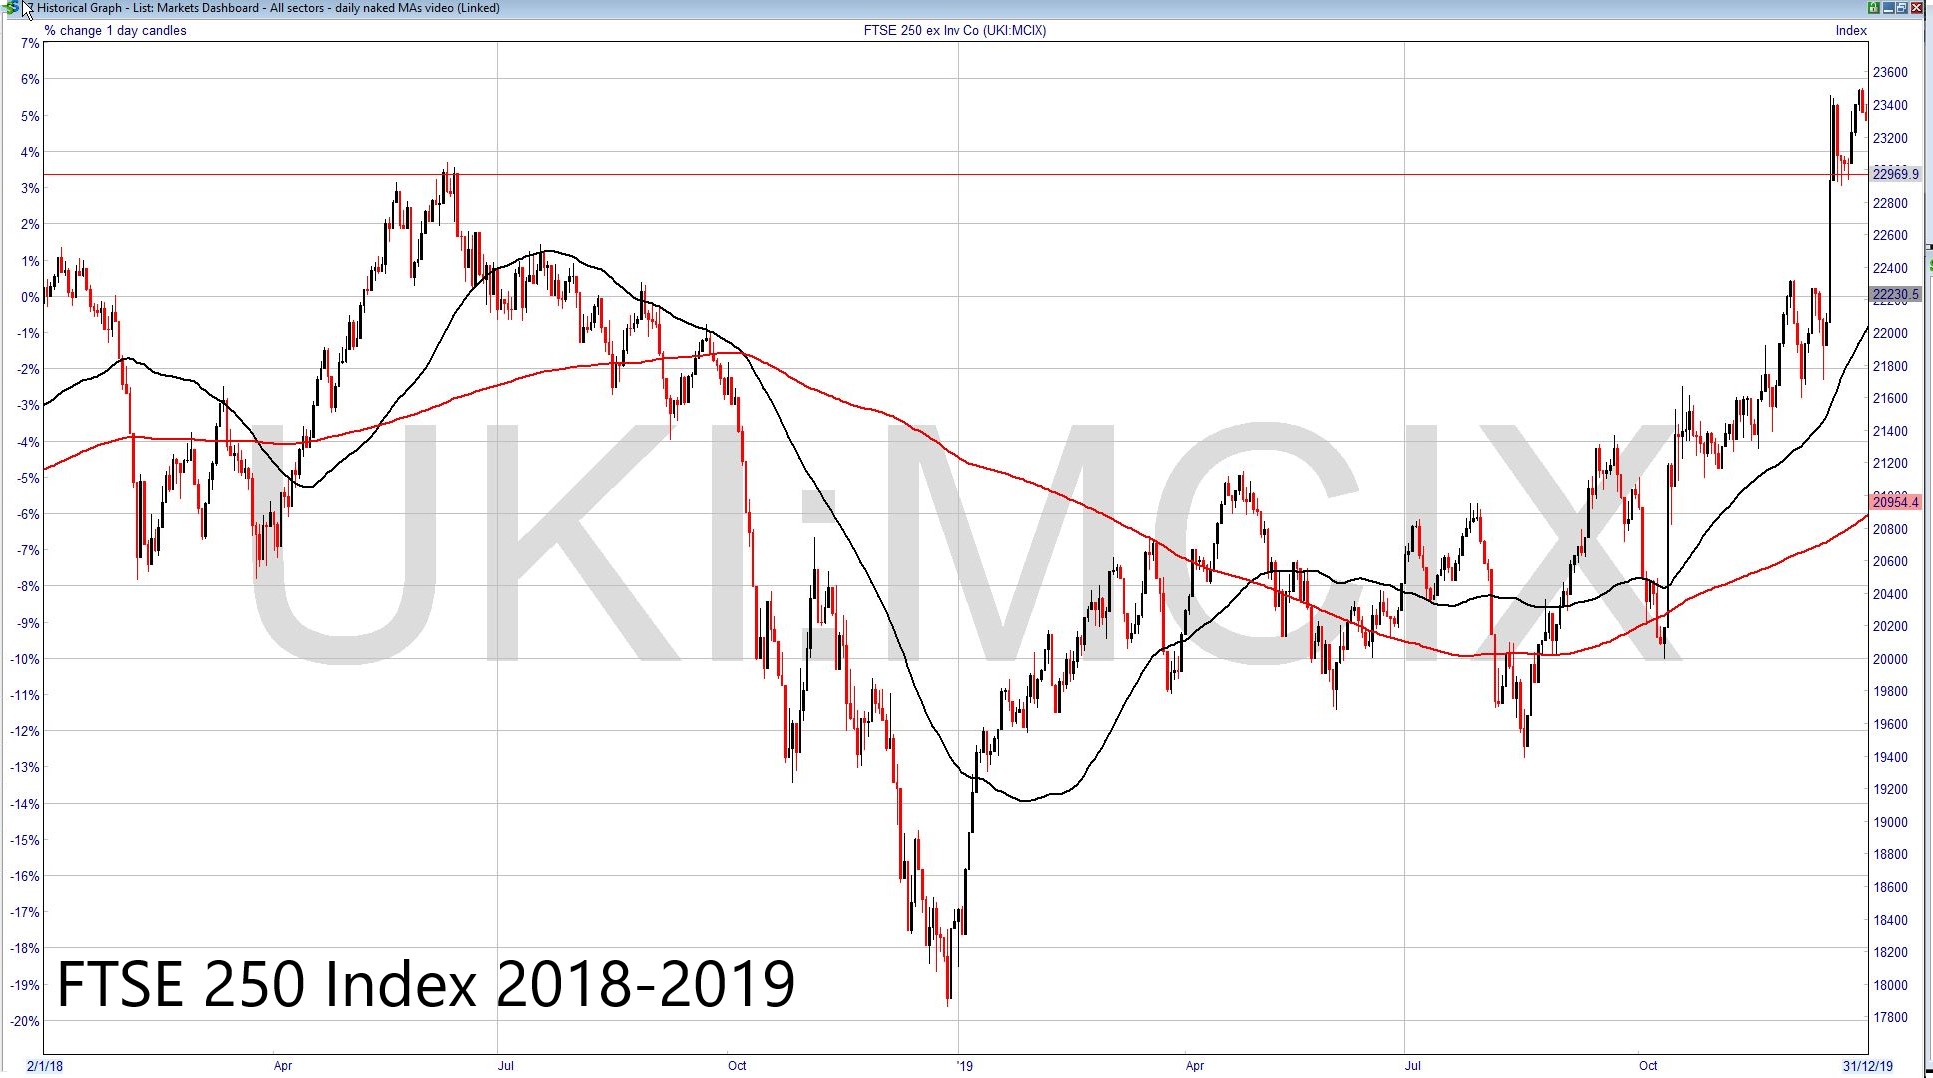
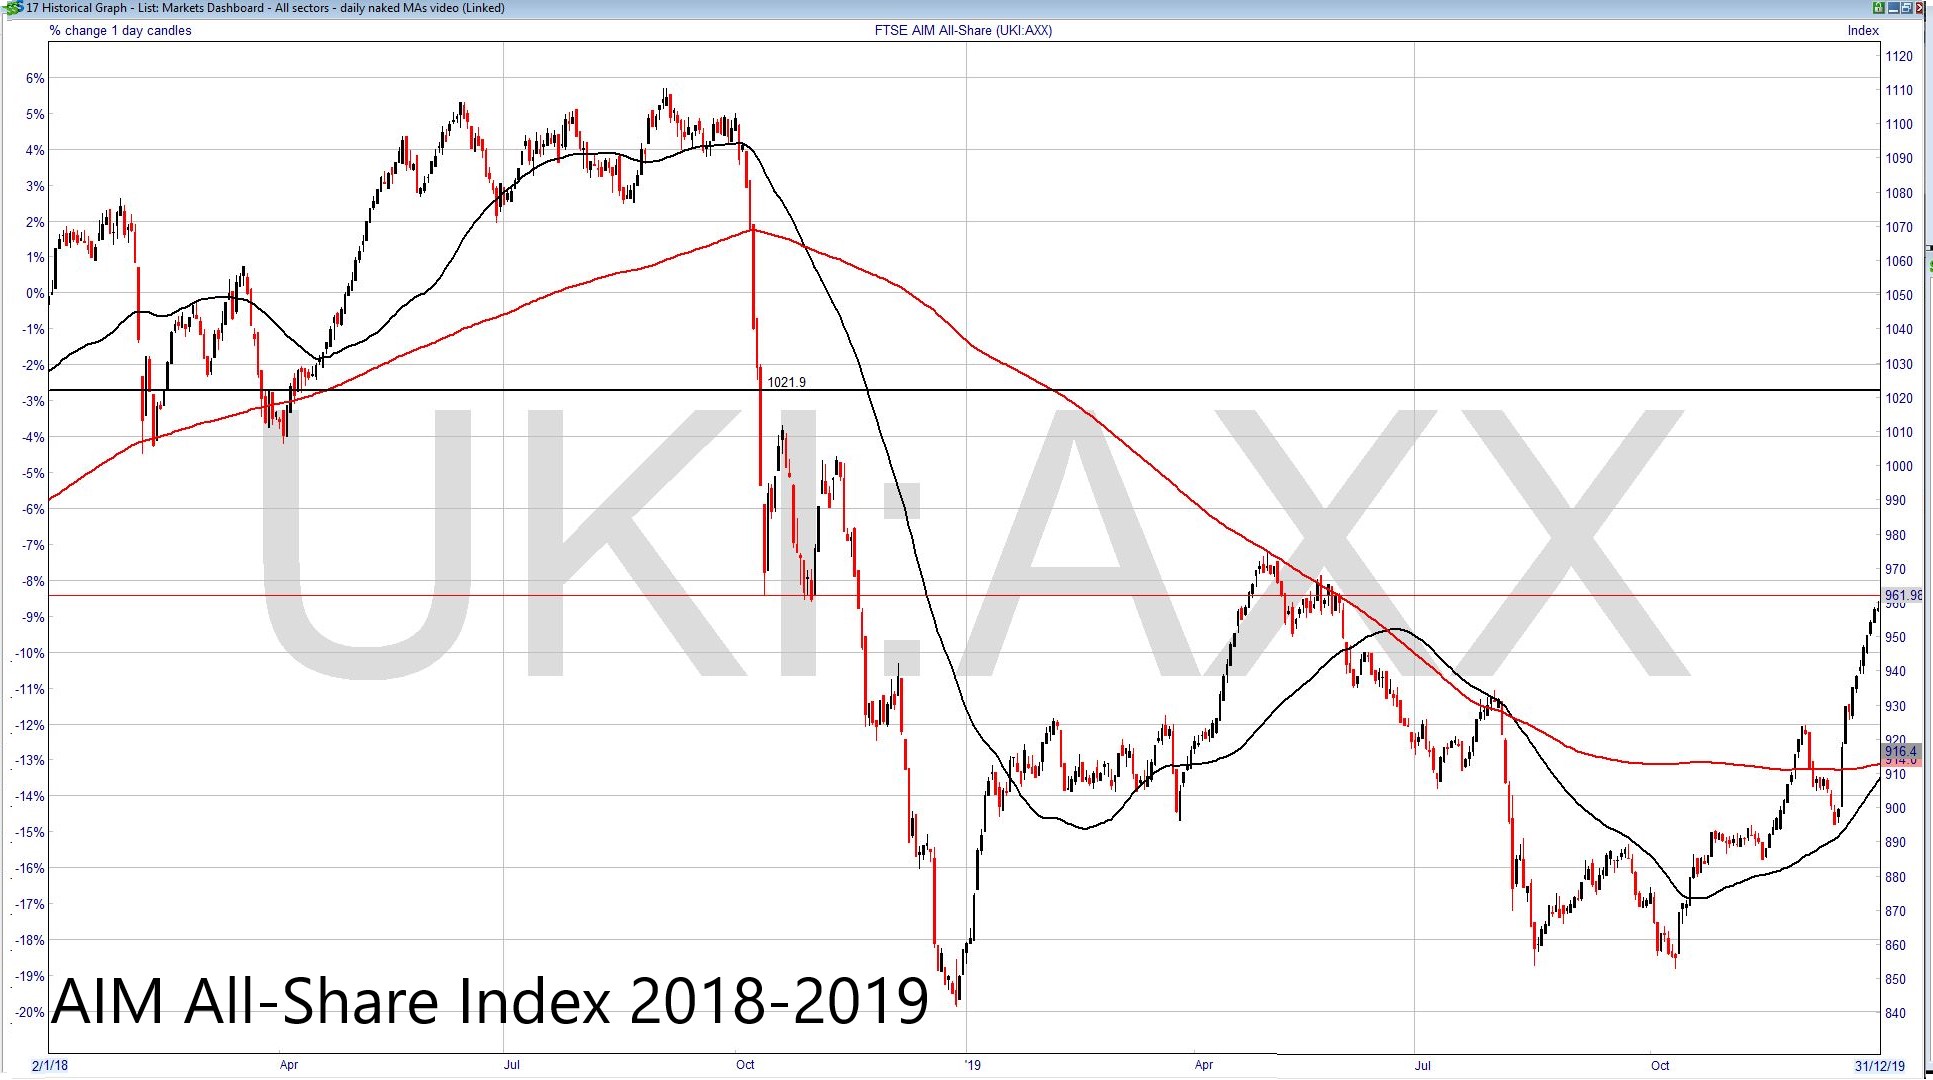
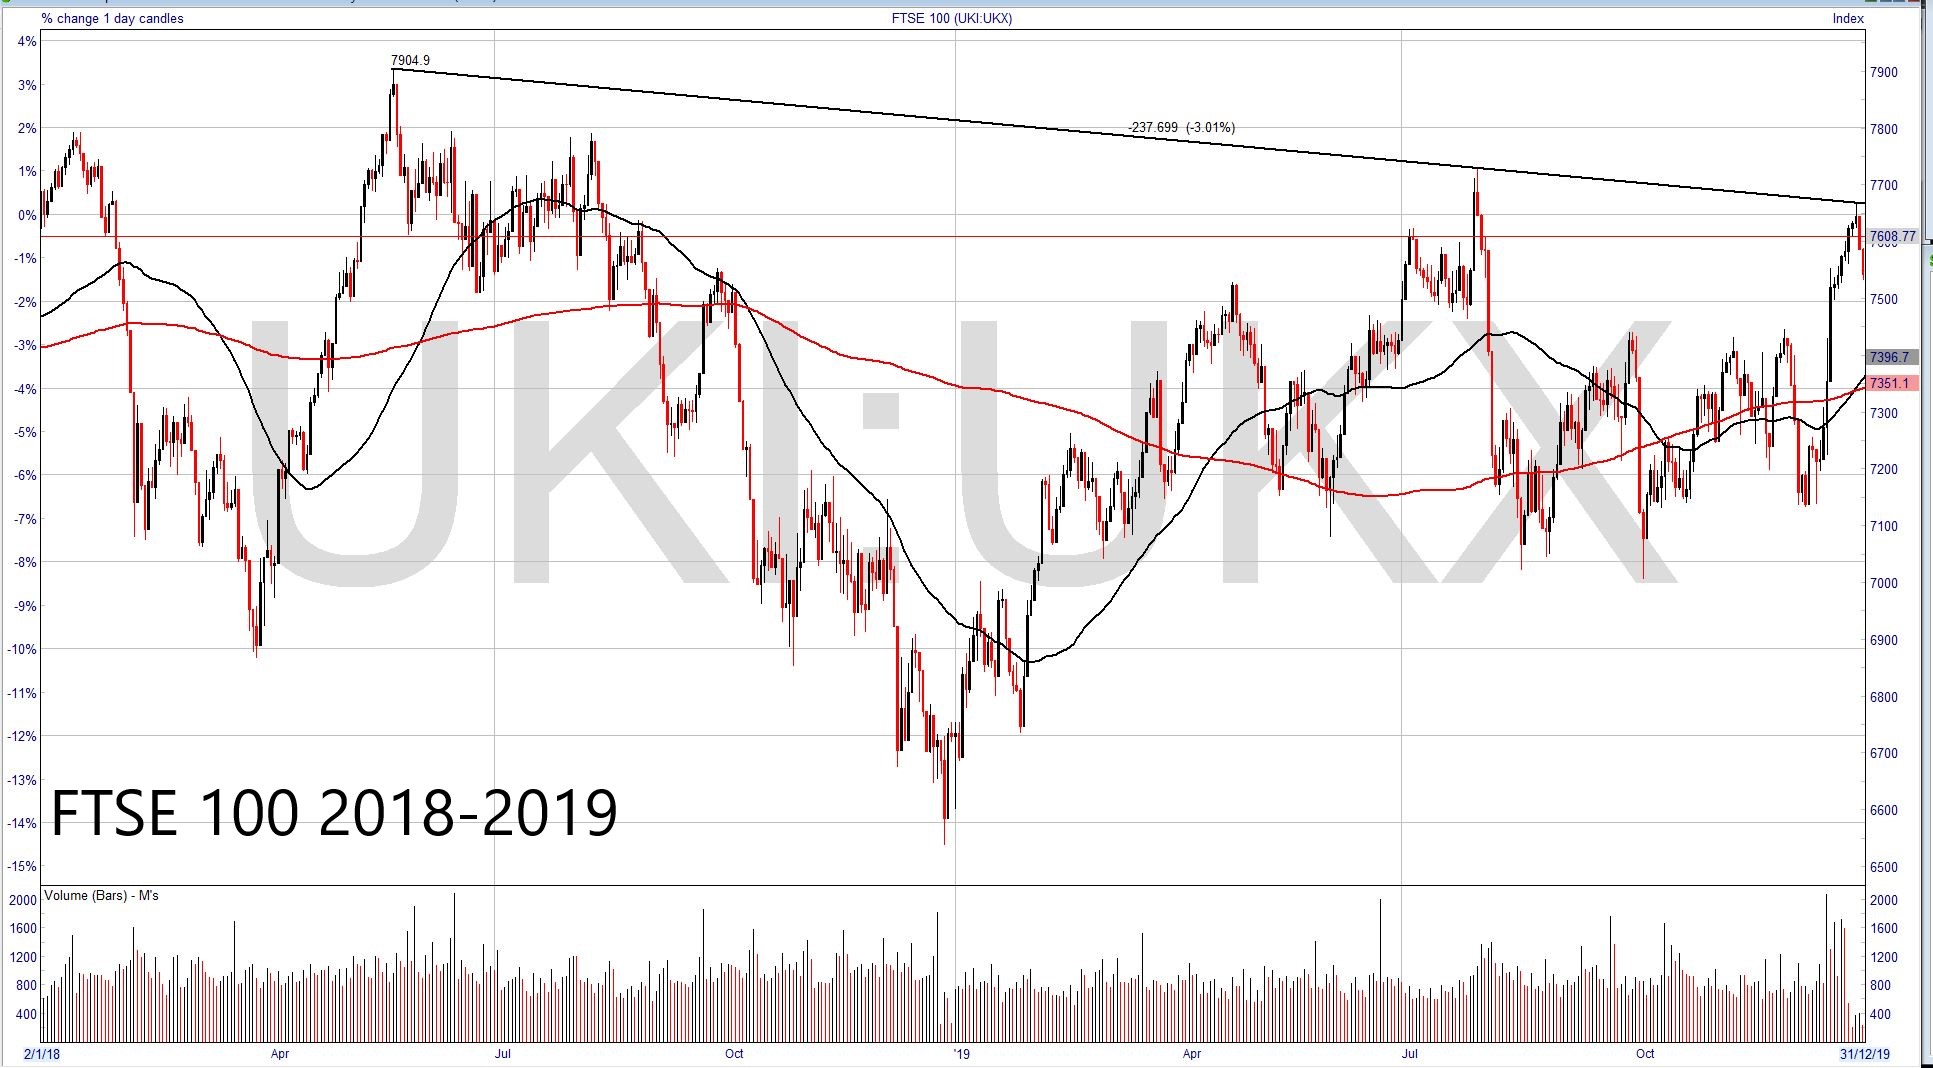
Few will bask in the afterglow of the 2019 rally without reflecting on the gut wrenching roller coaster that was 2018 culminating in a free fall plunge to close out the year. Figure 3 show 2 year plots for the FTSE 100, 250 and AIM-All Share covering 2018-2019 while Figure 2a shows the overall losses for 2018. The peak-to-trough variations in 2018 were even more precipitous. While the AIM All-Share lost over 18% in 2018, its peak-to-trough fall was almost 25% from the high of 1100 to the low of 840. That kind of fall qualifies as a technical bear market. The FTSE 100 and FTSE 250 indices made similar though less extreme peak-to-trough moves and both finished the year deep in the red at -12.5% and -17.5% but avoiding the -20% definition of a bear market. Not only did the traditional Santa rally not appear in 2018, but an unseasonable ravaging bear appeared in its stead wreaking havoc for many an investor.
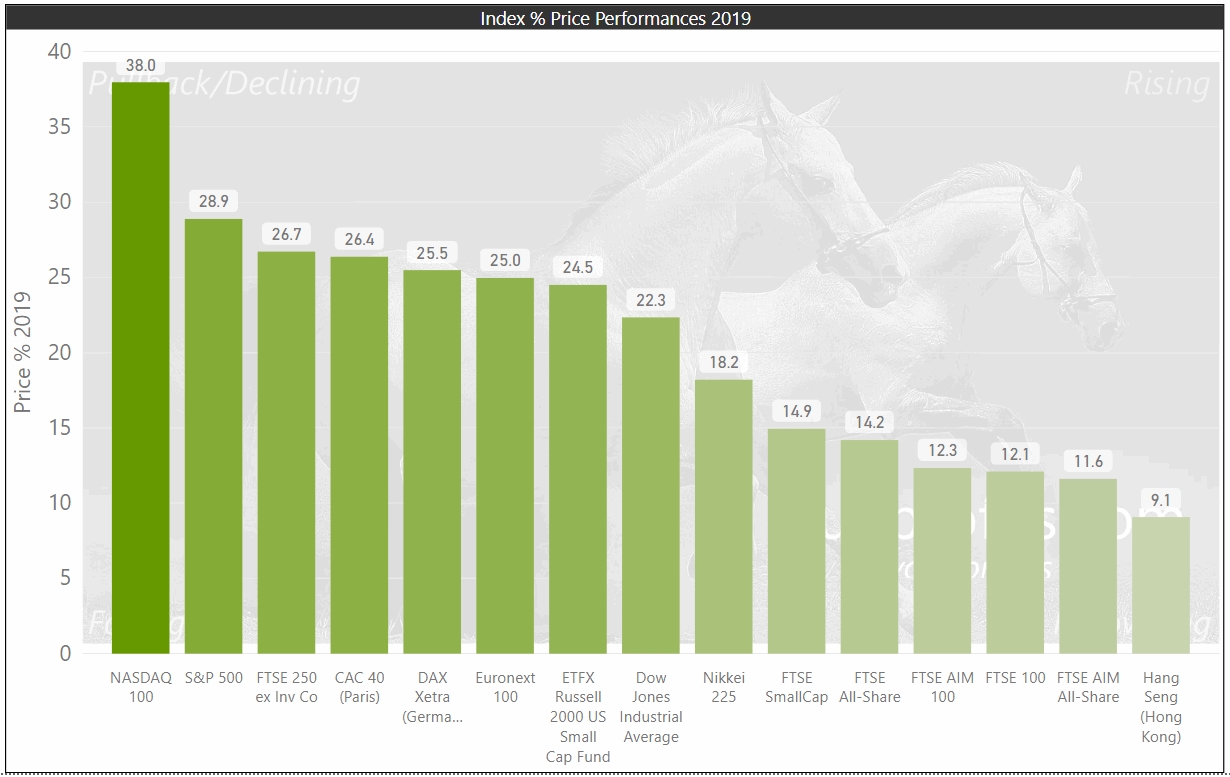
Figure 2a, 2b: Comparison of World Index Performances 2018 to 2019
click on each chart to expand
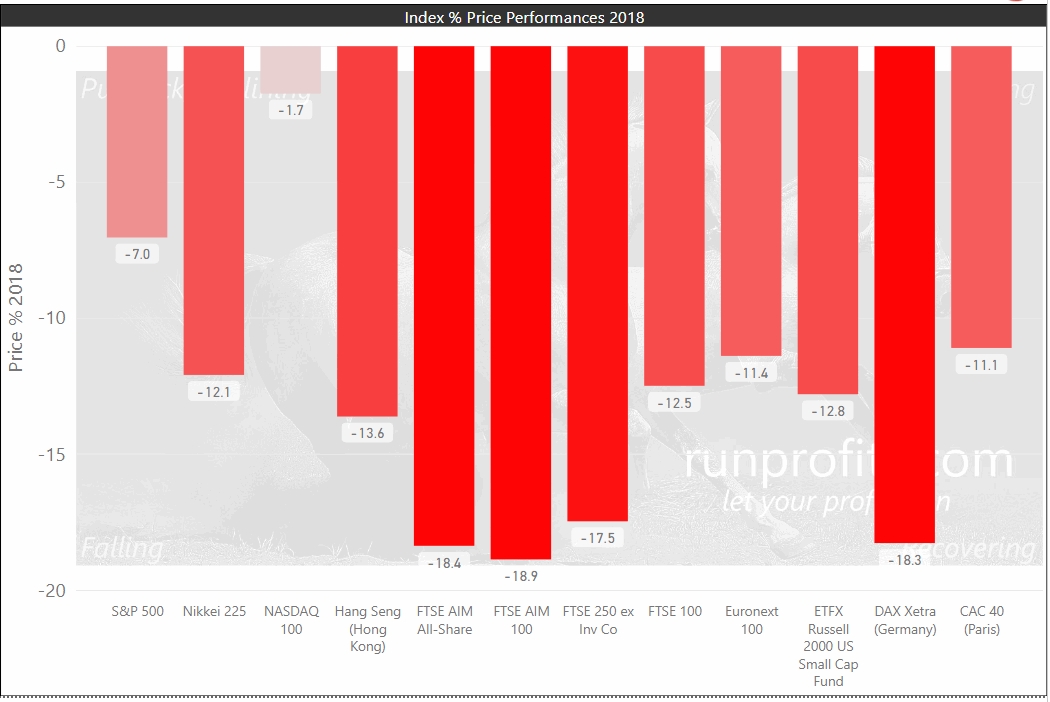
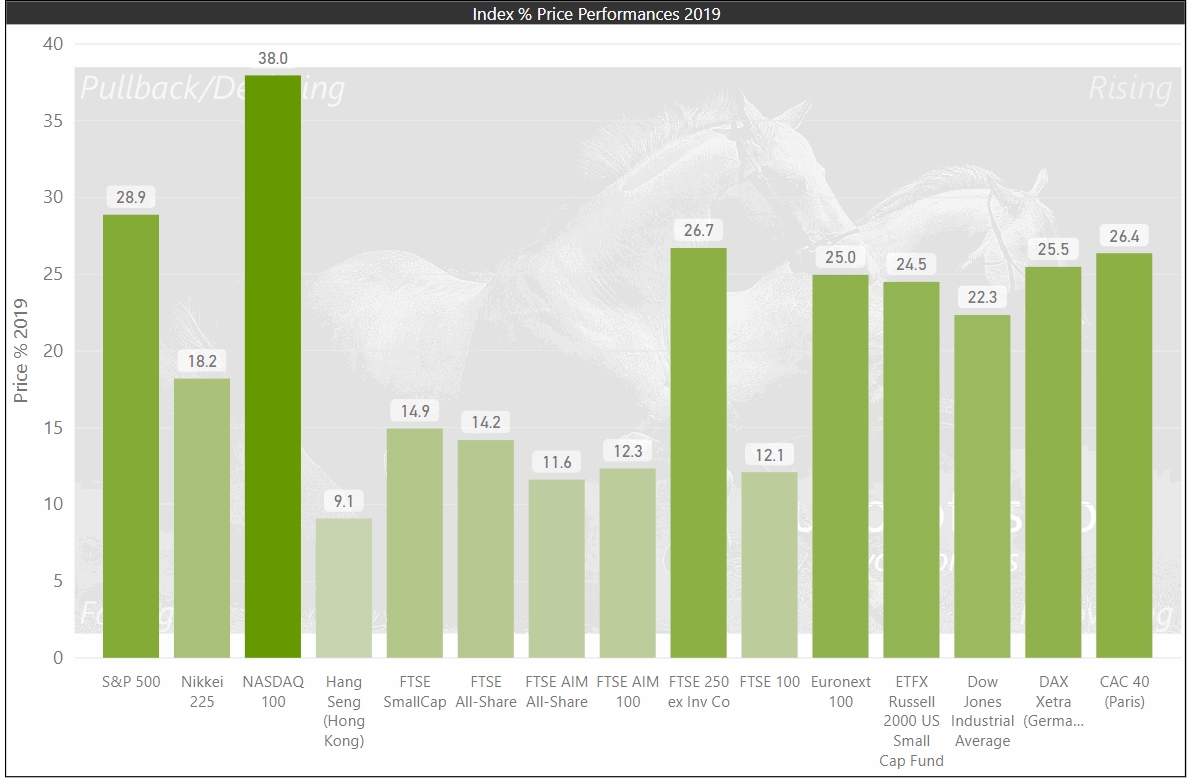
Figure 3 .Graphical Comparison of UK Indices 2018 to 2019
Use the scroll arrows to cycle through the FTSE 100, 250 and AIM All-Share charts for 2018 and 2018
2019: Run with the Bulls
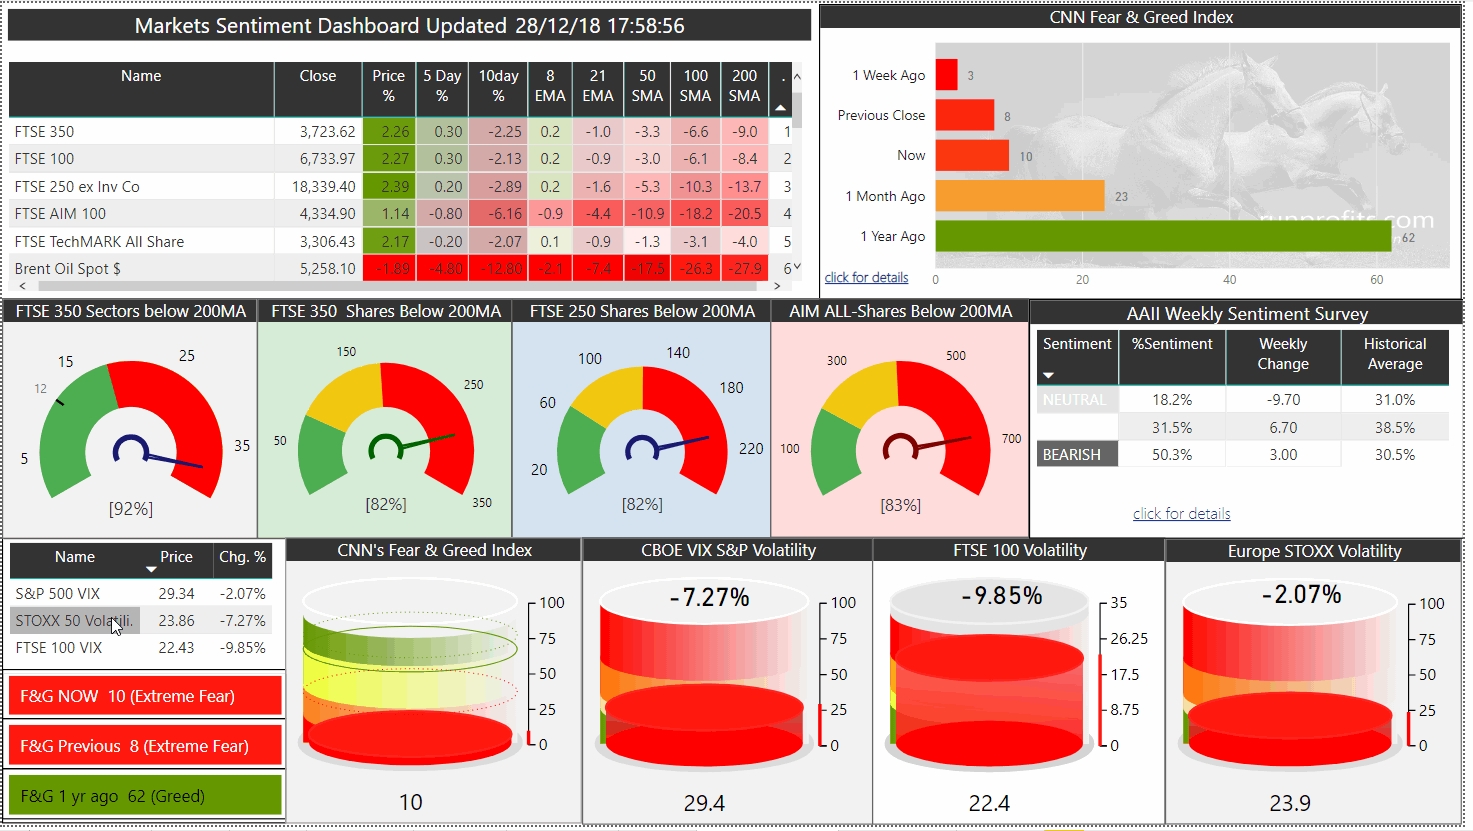
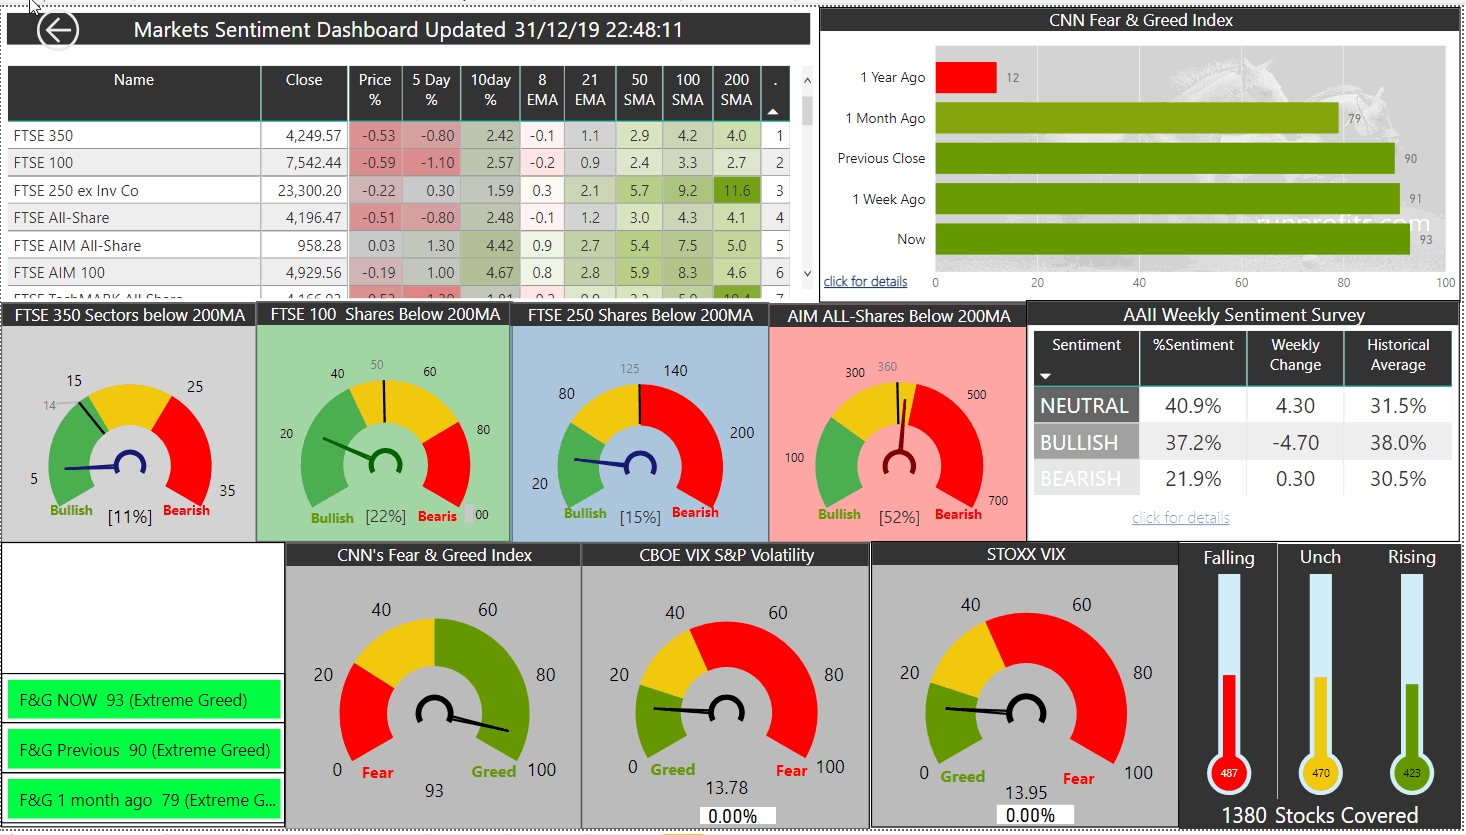
The level of despair at the end of 2018 is evidenced by the market sentiment readings at the time which showed almost peak pessimism. Figure 4a shows the sentiment dashboard from 28 Dec 2018 : a sea of crimson fear. Contrast that with the dashboard from 31 Dec 2019, Figure 3b: they are polar opposites so that if 2018 ended in doom and gloom, 2019 ended in giddy exuberance. Extremes in markets never last long so peak pessimism in 2018 set-up for a big upturn in 2019. Mr Market starting the new year with new resolve from day 1 and scaling the wall of worry with apparent ease. However, despite the great comeback in 2019, its worth noting that the FTSE 100 didn't recapture the 2018 high and arguably remains in a downward trend from the all-time high of 7900 set in May 2018. The AIM All-Share has languished even more and closed 2019 at 960 , still over 12% shy of the 2018 highs. The FTSE 250 did outshine both in relative and absolute terms where the index not only made up for its 2018 losses but eclipsed them and set a new all-time-high for the index. While the FTSE 100 had a very good first half of 2019, its performance was flattered by GPB/USD at lows not seen since 1985 giving a strong currency tailwind to its overseas earners. This faded (relatively) into the year end as the inverse relationship played-out with sterling, buoyed by the improving UK political landscape and Brexit resolution, denting some of the performers such that the July FTSE 100 high was not exceeded in the final December flourish.
So while 2019 was a good year, set in the context of 2018 and compared to performances in the US and European indices (Figure 1) it wasn't a great year with the exception of the FTSE 250. This probably suggests that outperformance is still outstanding for 2020 particularly for smaller cap shares and some of the larger caps. One obvious caveat is that finishing the year at such giddy highs may require some pause and digestion before moving higher so healthy pullbacks and consolidation in January-February '20 would not be surprising and, given current overt bullishness, should probably be expected.
Figures 4 a, 4b : Two Extremes of Sentiment Dec 2018 vs Dec 2019
click on an image to make full screen. Click off the image to close.
The Highs and Lows of 2019 - a Year of Bifurcation
As already highlighted, out-performance in 2019 was not even distributed. So while the mid and large caps had a good year, the same isn't true for the smaller caps. good measure of this can be captured by analysis of the performance of shares below the FTSE 250 £608m threshold compared to those above that threshold. Of the 1380 in the FTSE AIM and All-Share these segment as 983 below £608M with 397 above .
The 983 small caps split to a win:loss of 513:470, i.e an almost 50:50 split. By contrast , the split was 331:60 win:loss for mid/large caps in 2019 so a ratio of 5.5:1. Of the loser, 43 were in the FTSE 250 and just 17 in the FTSE 100
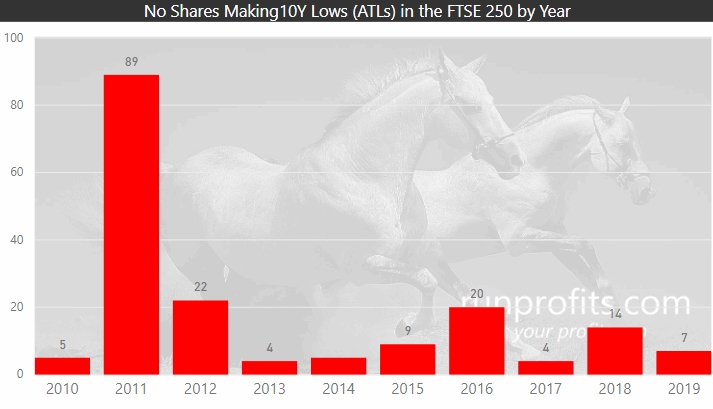
The contrast become more stark when comparing the number of 10 year/ all-time highs and lows for each of the main indices: this also gives a good measure of how broad the rally is (the lookback period was constrained to 2010 to avoid skewing from the GFC lows: some issues may be newer than 10 years in which case they are all-time highs or lows) .
Each of the main index highs, lows and sector breakdowns are outlined below. The data report allows these to be expanded into individual sector constituents as well as analysis of the index and sector lows. This type of analysis helps to identify the strong leaders with the view to buying on any pullbacks and equally spotting some high potential laggards who may play catch-up into 2020. The data report also breaks down each sector individually by constituent shares which can be sliced by index, market cap and price performance in 2019.
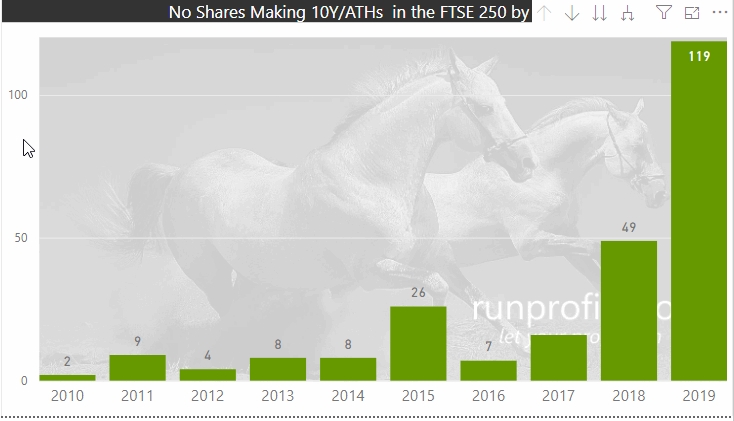
48% of FTSE 250 Share made 10 Year or All-Time Highs in 2019
Figure 5b shows the past 10 years of Highs for the FTSE 250: clearly 2019 was an outstanding year with 119 of the 250 shares making new decade-highs or all-time-highs This compares to 69 in 2018 and just 9 in 2011.Contrasting with the all-time lows in Figure 5a, supports the observation that the mid caps have performed very well in the recent past and the index has outperformed both the FTSE 100 and AIM All-Share consistently since 2009.
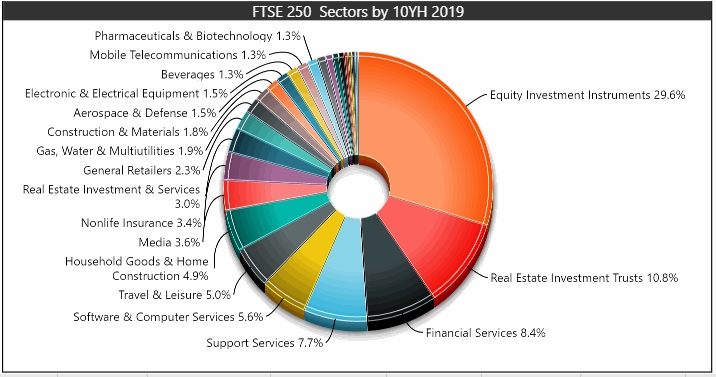
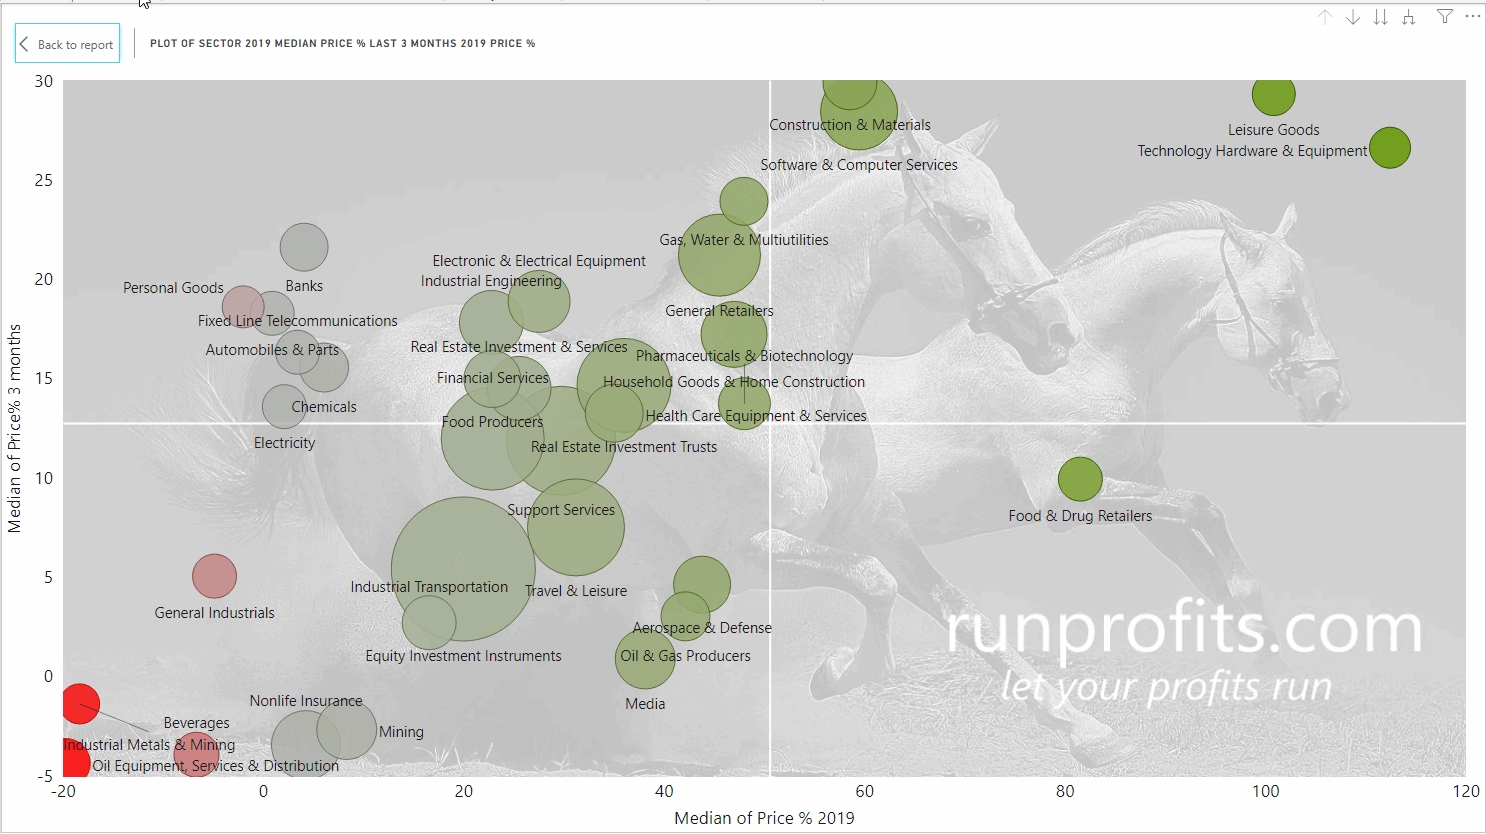
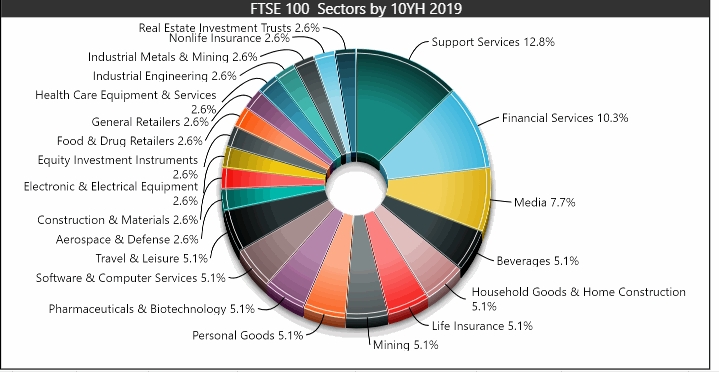
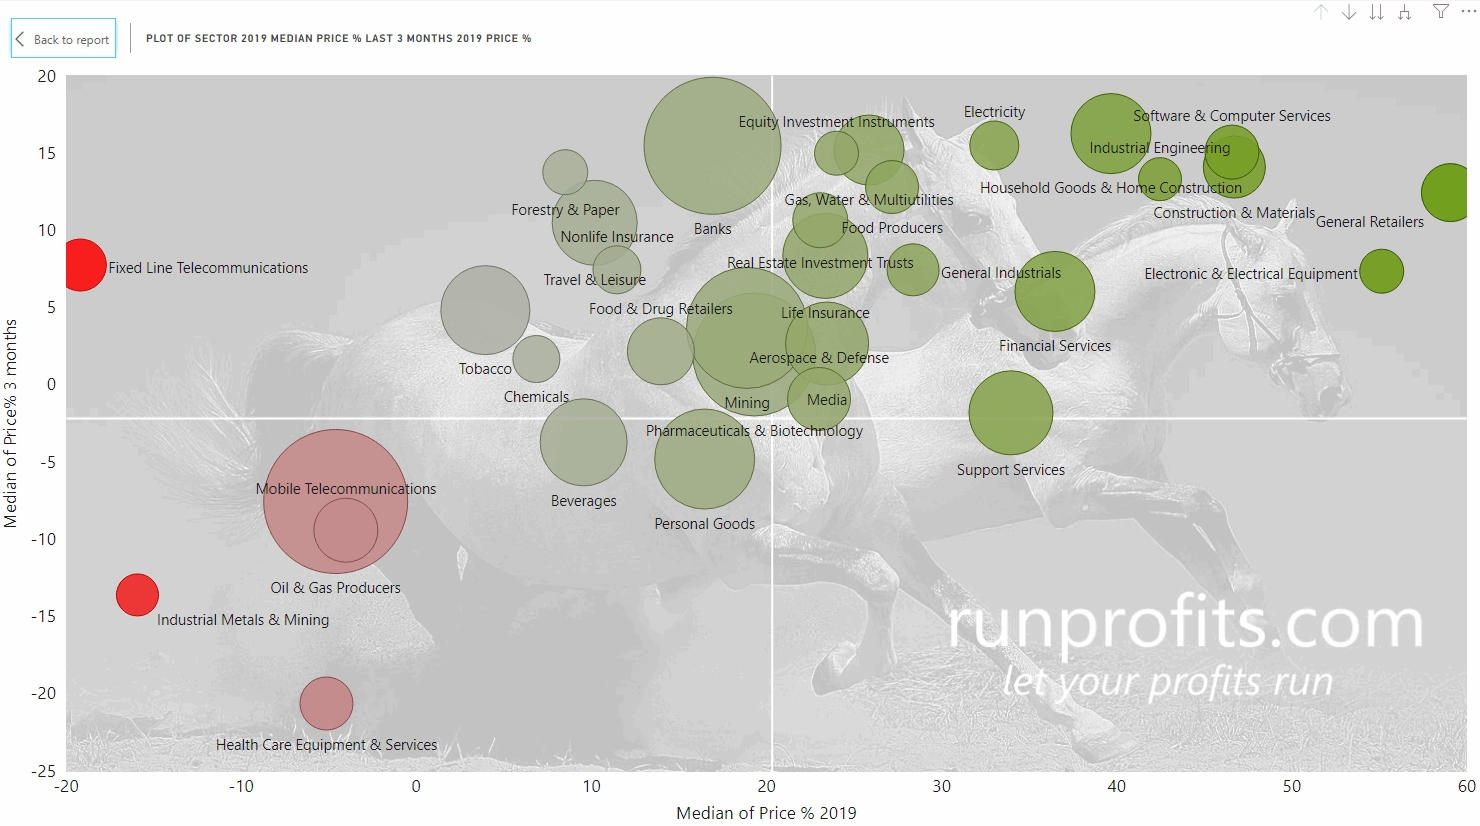
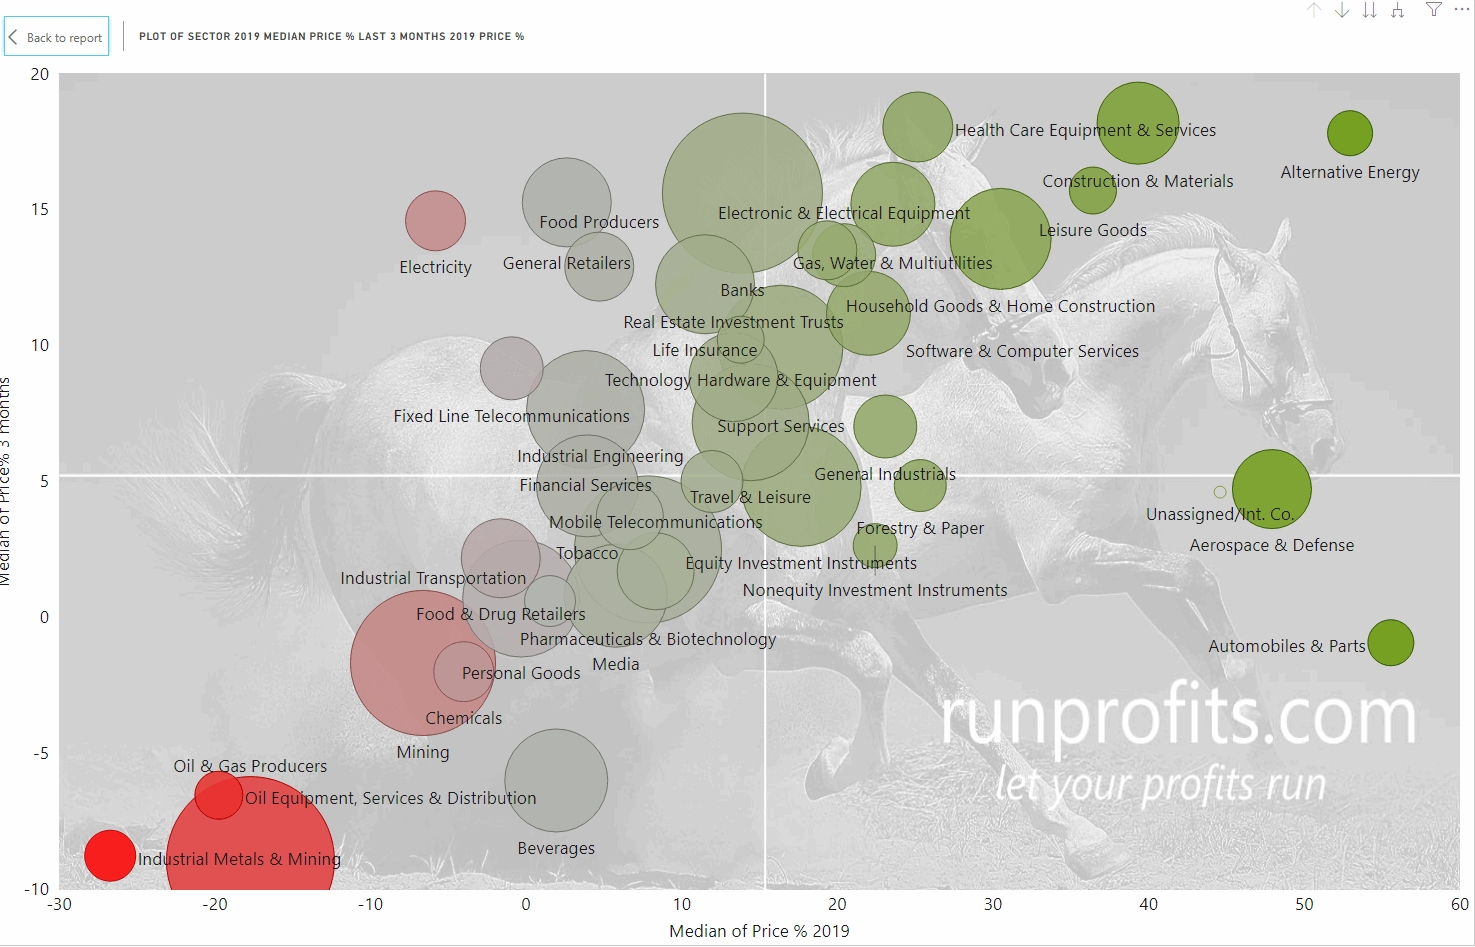
The data report breaks out the highs and lows for each index by sector and each sector by shares: Figure 5c shows these for the FTSE 250 while 5d shows the performance of each sector over 2019.
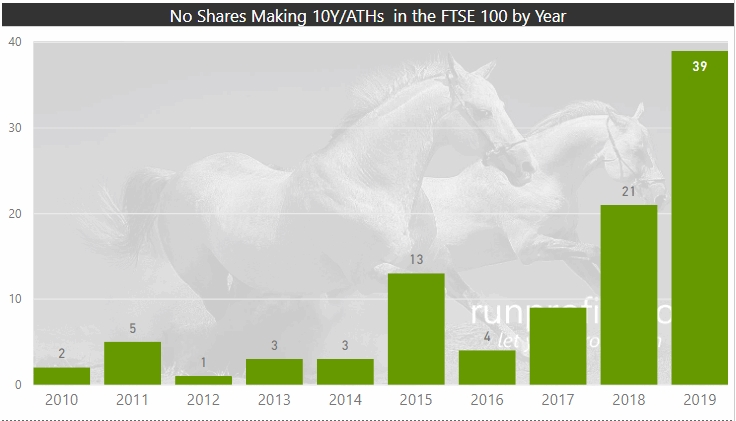
40% of FTSE 100 Shares made 10 year or All-Time Highs in 2019
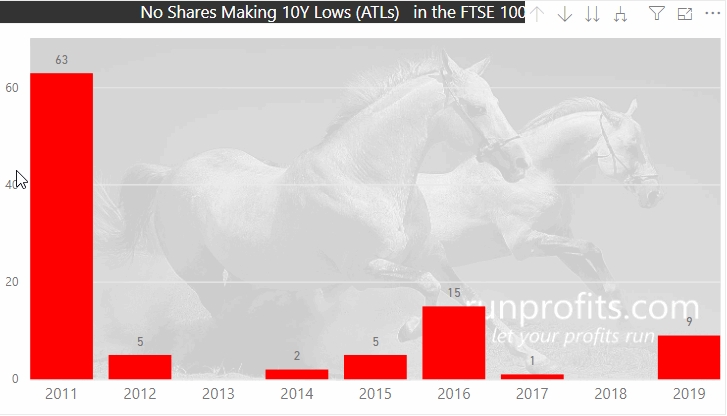
Almost 40% of the FTSE 100 made decade or all-time highs in 2019 , Figure 6b shows how this was almost double that of 2018 . Intuitively one would expect this to result in new highs for the index in 2019 over 2018. However, the weighted nature of index calculations mean that behemoths like RDSB and BP , both down over 4%in 2019, weigh heavily on the index performance. Figure 6d show how General retail (led by JD. , NXT and JE. ) made huge advances while Oil and Gas was in the red. Figure 6a shows 9 FTSE 100 shares made lows in 2019: these included SBRY and CNA which both made all-time lows in 2019.
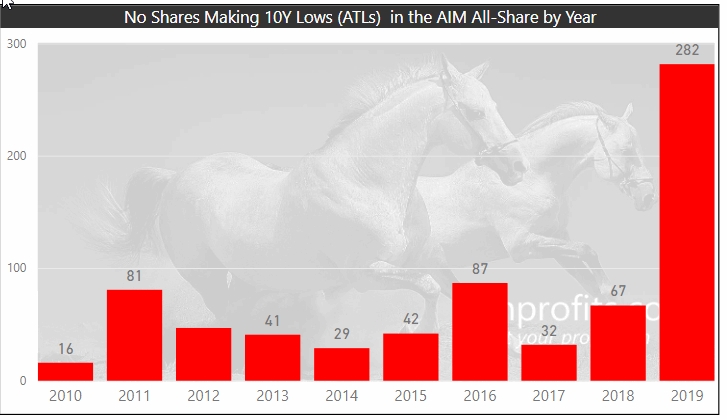
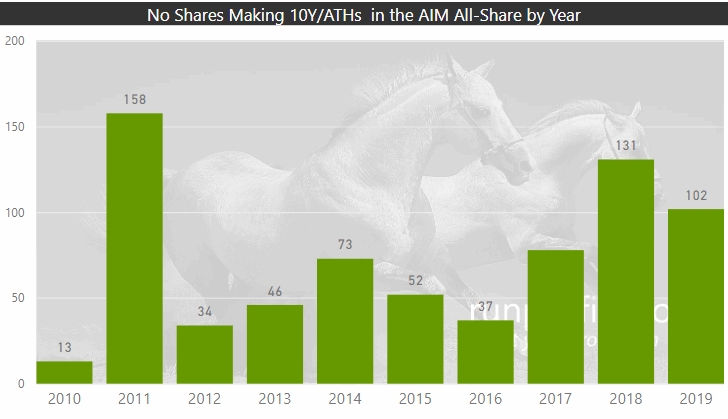
40% of AIM All-Shares Made 10 Year or All-Time Lows in 2019
Many private investors will have portfolios concentrated in small caps typical of the AIM index. 2019 was a year of underperformance for small caps with some stellar outperformers flattering the overall results. Figure 6b below gives a good illustration so while 102 AIM stock make all-time or 10 year highs in 2019, 282 made long term/all-time lows. This compares to 67 in 2018 and values in the range 14-80 for all years back to 2010 . Given the high the failure rate of AIM stocks, several stocks listed in 2010 are no longer around. Irrespective of the relative performance over time, 282 lows in absolute terms is 40% of the AIM All-Share in 2019.
While the AIM All-Share index made 12% on the year, analyzing the 721 shares in the AIM highlights the distribution of performance underneath the index topline*
Taking a mean of the performance of those 721 shares gives a value of 8% while the median shows a return of -1% which gives an indication of skew by the outperformers. Screening out the larger caps (>£608M as above ) and removing shares performing above 200% reduces the set by just 47 to 674 but drops the mean to 0% and the median to -4%. These are probably more reflective values for the typical performance of many of the small caps experienced by many private investors.
The contrast between all-time highs in the mid and large caps compared to all-time lows in the AIM small caps appears to be unusual. As for the narrative to explain this, one could also argue that small caps are disproportionately affected by the current low growth environment and are therefore better bellwethers of the “real economy”. Many of the mid and large caps have also flattered their share performance by financial engineering through share buybacks. The fallout from the failure of Woodford Capital's small cap debacle in 2019 may have affected overall appetite for small caps and has certainly heightened the focus on liquidity. Finally, as we are in the late stages of the economic cycle, investors may well be shunning riskier small caps for the safer mid and large caps. The number of 10 year/all-time-lows and the relatively poor performance compared to the other indices might be indicative of a type of capitulation low where small caps have been disproportionately abandoned. These often constitute the best times to buy and could mark a low point from which significant returns can be made in selective stocks.
(*the discussion above is based on simple mean and median values as opposed to indexing calculations performed by the LSE which use free floats, shares in issue and an indexing factor to weight the values))

In Part 2....
The second part of this series will take a deeper dive into the sector performances in 2019 identifying leaders and laggards and highlighting some emergent themes and potential opportunities for 2020 . Sign-up below if you want to be emailed when this is available.
Summary
2019 saw the UK markets bounce back with double digits gains across all indices and the FTSE 250 ranking third in the world in terms of performance adding almost 27% : the FTSE 100 added 12% and the AIM All-Share 11.6% (Figure 1). On the face of it, this would appear to be a stellar bull year with a rising tide lifting all boats. The backdrop of diminished fears of global recession, ultra low interest rates, increased monetary accommodation globally and the lifting of the Brexit cloud of doom all aided the UK markets in climbing what seemed to be an insurmountable mountain of worry at the end of 2018.
This article takes a look beneath the numbers and contextualizes the 2019 performance in terms of recent years and in direct comparison with that of 2018. 2019 was a year that greatly favoured the mid and large caps while punishing many of the small caps. Almost half of the FTSE 250 shares made new ten year or all time highs in 2019 with 40% of the FTSE 100 doing similar .. in stark contrast 40% of the AIM All-Shares made ten year or all time lows. This suggest an imbalance in how these markets have been allocated and the potential for significant opportunities in the small cap space .
Many of the highs were made in the final quarter and concentrated in December post the UK election result: market sentiment data from end December '19 is compared to that of end 2018 to highlight the swing from extreme fear to extreme greed.
The performance data for UK indices, sectors and shares over 2019 is included in a fully interactive 60 page report which covers 1380 shares in the 41 UK sectors. This allows individual analysis and interrogation of the underlying data using powerful visual data mining techniques to enable bespoke research and data-driven insights. The report is available at the link below and will be updated throughout 2020.
Part 2 of this article series will take a deeper dive into sector performances looking at the leaders and laggards and identifying potential themes for 2020.