
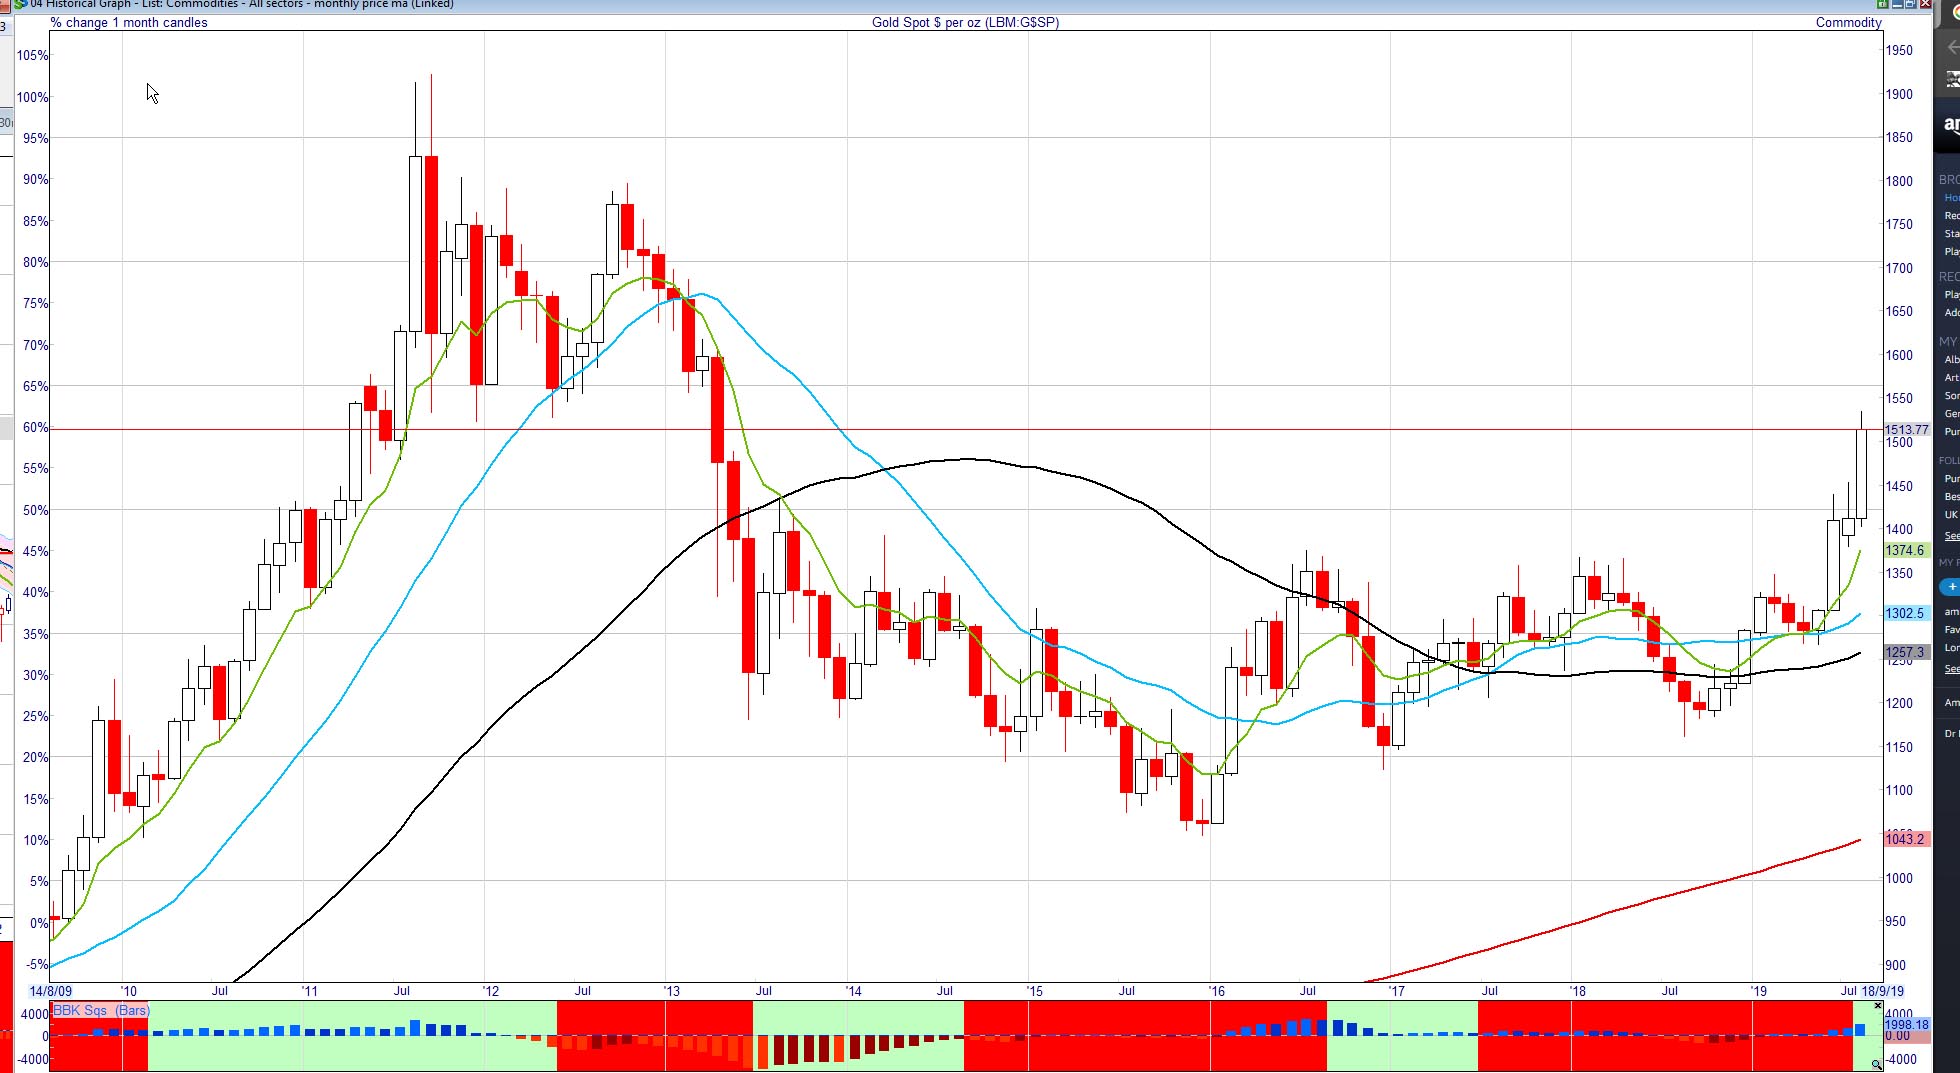
The yellow metal has had a stunning run over the past few months and is currently up over 18% YTD making it one of the best performing “assets” of 2019. Gold had languished for several years after its highs of over $1900 in 2011 dropping back to below $1100 in 2016 as risk assets and equities enjoyed a roaring bull run. Recent concerns with global growth, currency risks, negative bond yields, US-China trade wars and growing levels of sovereign debt have increased the attractiveness of gold as a safe haven and store of wealth. Unlike fiat currencies, gold is a finite resource in a world where markets are awash with cheap and devaluing currencies. The narrative for the below is articulated in trading terms: an equally valid narrative could be expressed in terms of the preceding macro.
This year’s rally was presaged by a well-formed cup and handle chart pattern which very often precedes a major change in trend and a reversal in price. The cup began forming during 2018 and is a result of price gradually basing and reaching a low which occured in Oct '18 with a low of $1167 and then gently recovering to complete the base. There followed a period of consolidation and then a move to a check the previous 2018 high near $1350. This was summarily rejected as price went on to form the handle in the C&H pattern - Figure 2.
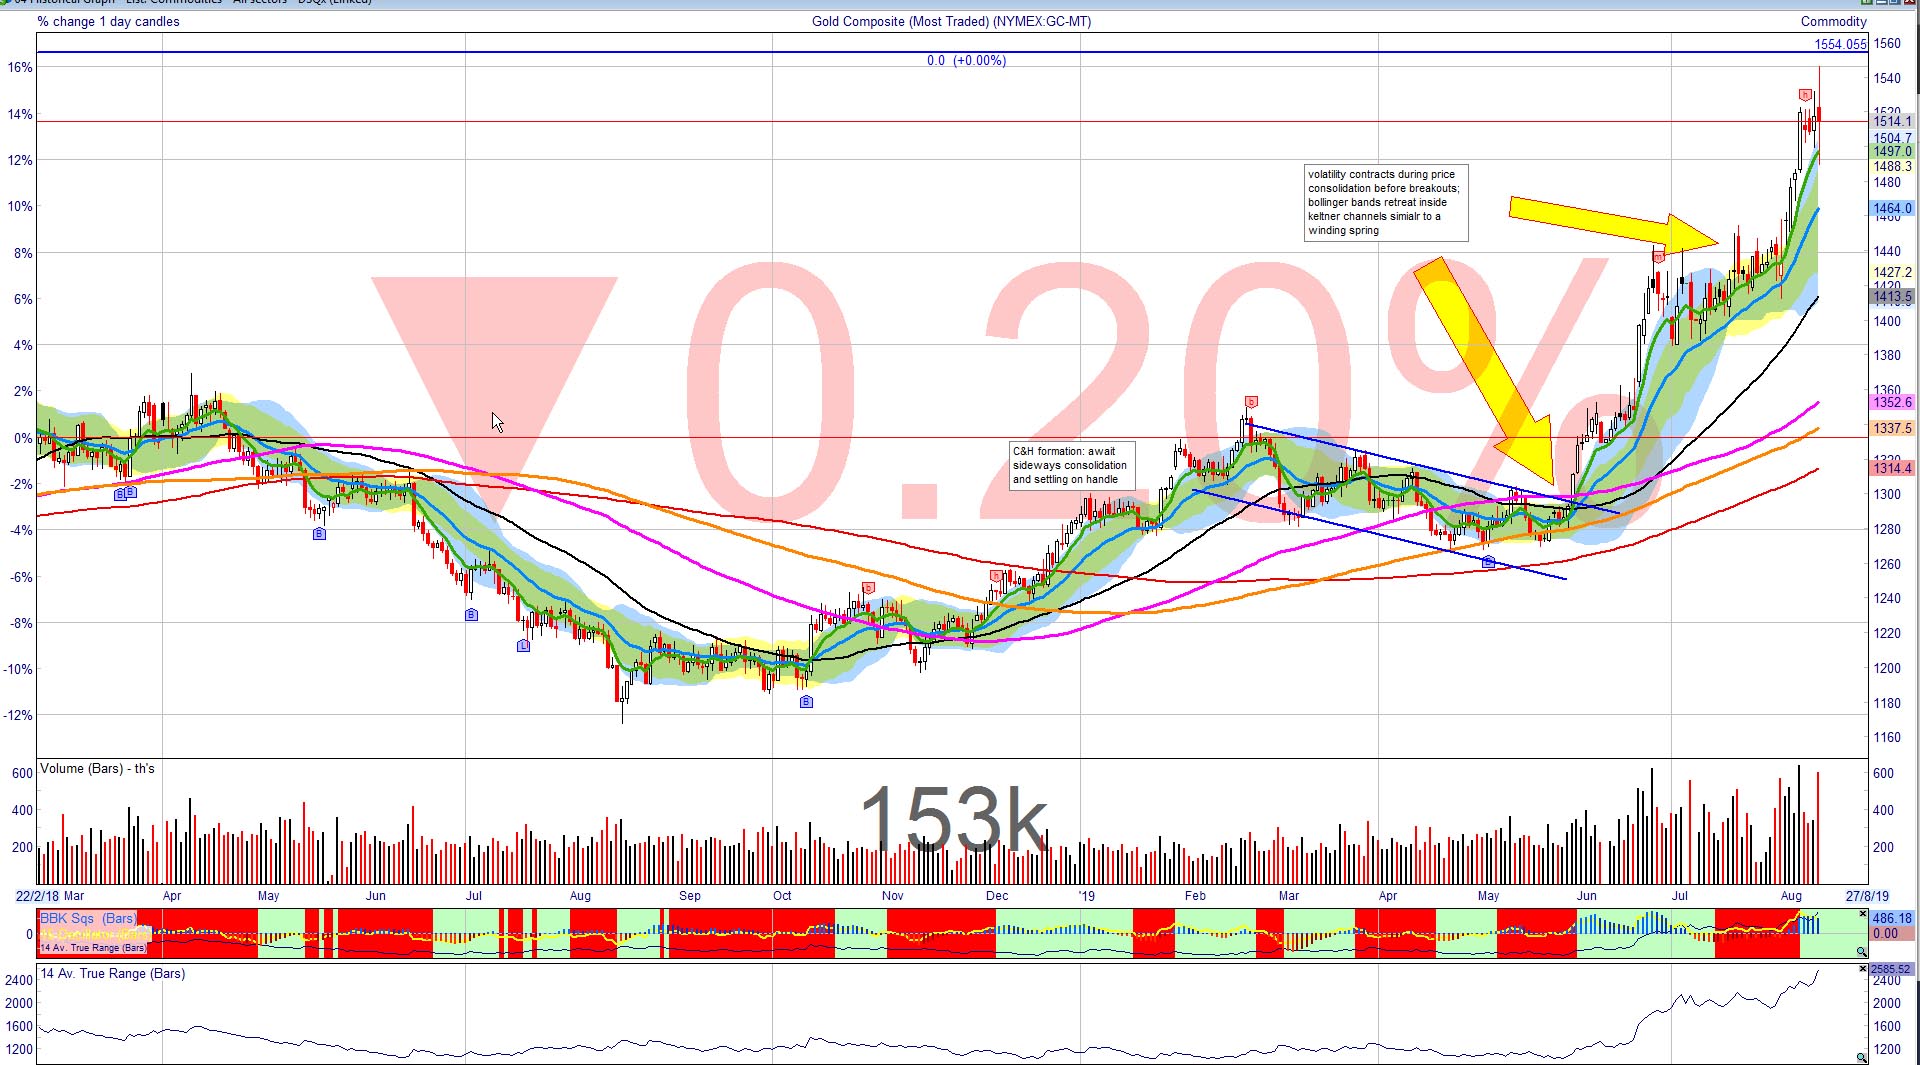
The breakout from the consolidating handle of the pattern occurred in June 2019 and was supported by a volatility squeeze which had been forming during May and June. A volatility squeeze is characterised by a reduction in price volatility akin to a spring being wound: positions are being accumulated and demand is slowly exceeding supply (or vice-versa prior to a breakdown). Volume will often decrease in these periods as the number of trades within the price range becomes fewer. Technically it is characterised by the Bollinger Bands contracting and falling inside Keltner channels: this generates the set-up while the breakout generates the trigger (though a momentum indicator can be used to front-run this with a higher risk but better reward). The resulting breakout is often sudden and often has a lifetime and intensity linked to the period of consolidation (the longer in base the further in space). This pattern is my favourite and most successful trading pattern and works across asset classes and timeframes. Probability of success is greatly enhanced by an increase in volume on the breakout which will give more confidence to the move as volume expands into the breakout (the force behind the coiled spring)
Having made its first major leg-up from $1280 to $1440 in late June, gold went through a period of consolidation as it digested the big move. Profits are taken, new positions opened as price moves through ever decreasing daily ranges. Another volatility squeeze was setting up in the last two weeks of July. The period of consolidation was much shorter this time which is a bullish sign of momentum growing. Price dipped on 1 August to check the $1400 level support and then rallied a further $100 in 5 trading sessions with growing volumes.

Trading Gold using Spreadbetters (Caution: Risk and Losses!)
Gold’s sharp pullback yesterday proved short-lived and provided both a logical take-profits for short term longs and an opportunity to take advantage of the dip to get long. The snap-back from 1480 to the $1500 level with consolidation did set-up as a break-out on the hourly time frame. Many longs will have been flushed by running stops below the $1500 level as algos will seek out liquidity and run stops clustered below a round number target.
I will often trade gold during times of volatility and fear as a hedge to longs and a useful income generator. Spot gold can be traded on spreadbetting platforms and offers good liquidity and tight spreads so transaction costs are low. Care needs to be taken in position sizing and risk management given the volatility and dependence of gold on currencies (especially USD) and macro data such as interest rate announcements, GDP, unemployment etc
Spot gold has an ATR of 2450 cents ($24.5) on a $1500 spot price : so every £1 traded is a 1500*1 = £1,500 exposure. Day trading can allow a higher position size but requires a lot of screen watching: swing trading over several days to weeks needs to allow for the underlying volatility.
As a general rule I apply 3xATR as the typical stop-loss for a swing trade so in the case of gold with a $25 ATR, a stop loss of £75 per point is needed to allow for the inherent volatility to prevent being whip sawed out by vol. Clearly even on a modest £10pp this needs a £750 stop loss (S/L) so position sizing according to account size is key to avoid concentrating too much risk in one trade. The best strategy in trading gold is scaling into positions starting small and adding as the trade moves in your direction. Care must also be taken trading into major liquidity events such as rate rise announcements, GDP etc. Taking partial profits, scaling back out to reduce position sizes or just going flat and trading the reaction are all viable strategies prior to major event and will be defined by your overall strategy, timing and risk tolerance. The Economic Calendar on runprofits shows when these events take place and gives a volatility score shown as Imp. (Implied volatility)
I would urge extreme caution in trading gold on spread betting platforms owing to its volatility and ATR. It is not unknown for spot gold to move by tens or hundreds of dollars in short periods.
Gold can also be traded by taking positions in gold miners which I will cover in a separate article.
Where is gold going to?
Trying to predict the future is a pretty futile exercise especially these days when markets can react rapidly to the “Tweeter in Chief”: trend following however, does lend itself to identifying parameters from which to design your trade and set-out rules to take profits and most importantly, preserve capital. In these instances, I will often ride a trend until it changes, having done the analysis to know where levels of supply and demand sit and where the associated levels of resistance and support will likely lie. Price action around these levels will then inform execution parameters and provide insights on trend change.
In the case of gold in its current phase, price is in a strong uptrend and is respecting its 8 and 21 EMAs. Since the end of May ’19, spot gold has not had two sequential closes below the 21EMA and has rarely dipped below this level. This is very typical of high momentum trades so a general rule of thumb is to stay in the trade unless there are two or more sequential closes below the 21EMA. The distance between price and the 21EMA will therefore need to fall within the stop loss which should also accommodate the ATR to allow for volatility. A successful swing trade will need to accommodate these parameters. To allow for these the position size should be adjusted to incorporate risk management and avoid whipsawing. When layering, this may result in multiple different stops to reflect the different partial positions . Again, never allow the total position size to exceed your risk parameters: I use a simple trade journal in Excel to update with price and stops so my position sizing and risk is managed across all positions : this also gives a rapid view of total exposure and potential draw down .
Using the above parameters with trailing stops obviates the need to have a defined target. That said, gold may encounter some resistance above $1530 while also being prone to more profit taking and deeper pullbacks given the recent run: this trade has been running for several months now and will eventually become crowded and unstable. Keeping an eye to changes in price action around key levels and moving averages will reveal more and inform any changes needed to trade parameters.
